Is there a connection between countries’ human development, fisheries data and the way ocean resources are managed? There is one (or many), indeed.
The lower a country ranks in the Human Development Index, the fewer fisheries resources it tends to extract but, also, the fewer records it keeps about the way it exploits its marine resources.
The Sea Around Us catch reconstruction method is especially useful to make sense of the state of fish stocks in data-poor regions. By using this approach, researchers are able to incorporate best estimates of unreported catches and complement both national statistics and fishery data assembled and reported by the Food and Agriculture Organization of the United Nations on behalf of all maritime countries and territories in the world.
These more accurate data tend to reflect the reality in the field; they are a numerical snapshot of what’s going on in coastal communities. This is why linking the Sea Around Us data to the Human Development Index website and each of its country-specific web pages was inevitable.
The Sea Around Us researchers recently completed the process of embedding the HDI into the pages’ interactive fisheries data for 282 Exclusive Economic Zones. “This was important because we needed a way to demonstrate how socio-economic conditions or circumstances might reflect on the behaviour and evolution of the world’s fishing fleets,” said Project Manager Deng Palomares.
The Human Development Index is produced by the Human Development Report Office for the UN Development Programme and it is based on an approach developed by the economist Mahbub Ul Haq, according to which people and their capabilities should be the ultimate criteria for assessing the development of a country, not economic growth alone.
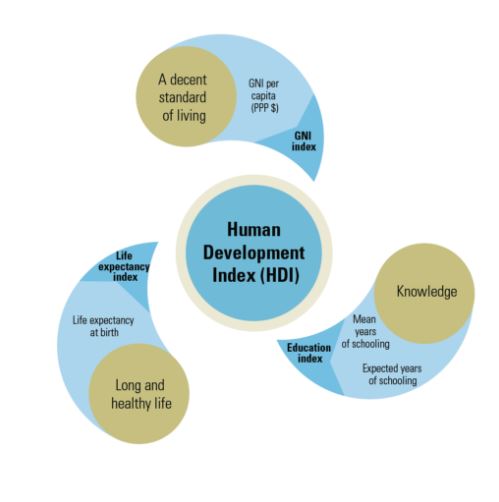
In detail, the HDI is the geometric mean of normalized indices for three key development dimensions: having a long and healthy life, being knowledgeable and having a decent standard of living.
According to the Report Office, the health dimension is assessed by life expectancy at birth, the education dimension is measured by the mean of years of schooling for adults aged 25 years and more and expected years of schooling for children of school entering age, and the standard of living dimension is measured by gross national income per capita. Once the scores for the three indices are gathered, they are aggregated into a composite index using geometric mean.
In summary, the Index shows what is being done or not to improve people’s well-being by giving them more freedom and the opportunity to live lives they value.