

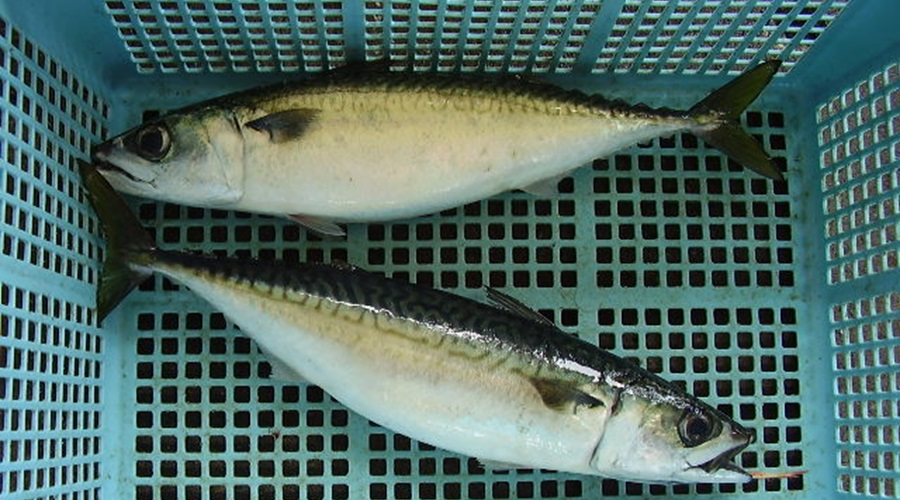
Global warming is expected to push stocks of highly migratory straddling species in the Indo-Pacific, such as chub mackerel, from EEZs toward the high seas by mid-century. Photo by Matsumomushi, Wikimedia Commons.
Sea Around Us website users will now be able to access the Mean Temperature of the Catch (MTC), as an ecosystem indicator derived from the reconstructed catches of a large fraction of the 283 Exclusive Economic Zones (EEZs) presented on our website.
The Mean Temperature of the Catch is an index computed from the preferred temperature of the species caught from a water body and the fisheries catch by species. The MTC, thus, answers the question: How are species exploited by fisheries reacting to the increase in temperature in the water surrounding them?
As a consequence of global change, the MTC of many EEZs tends to increase, with the graph illustrating it resembling the hockey-stick figure typical of global warming studies. This is due to exploited fish populations shifting from their warming habitats toward areas that still have the temperature they prefer, usually further north in the Northern hemisphere, and South in the Southern hemisphere (i.e., poleward).
For the MTC trend to increase (often starting in the 1980s), the available catch statistics must be detailed at the species or genus level, which is not (or only partly) the case for the EEZ of many countries and territories. Also, the MTC cannot increase in the EEZ of tropical countries, as the fish catches that decline therein because of increasing temperatures are not replaced by fish from even warmer areas (the ‘hypertropics’ don’t exist!).
The Sea Around Us is currently improving the reconstructed fisheries catch statistics of all maritime countries and their territories, which cover the years 1950 to 2019, and updating them to 2022. When this task is completed, the MTC will be recomputed everywhere, and we are confident that more EEZs will then exhibit the hockey-stick pattern.
“Like most of the indicators that we present on the Sea Around Us website, the MTC summarizes a variety of complex processes, showing shifts in ecosystems that might otherwise go unnoticed and helping researchers understand long-term trends in fisheries,” said Dr. Daniel Pauly, the Sea Around Us Principal Investigator. “This understanding should lead, ideally, to designing and implementing proper interventions.”
To access the MTC, users have to scroll down to the bottom of each EEZ page and click on the Mean Temperature of the Catch link, located under the Indicators section.