
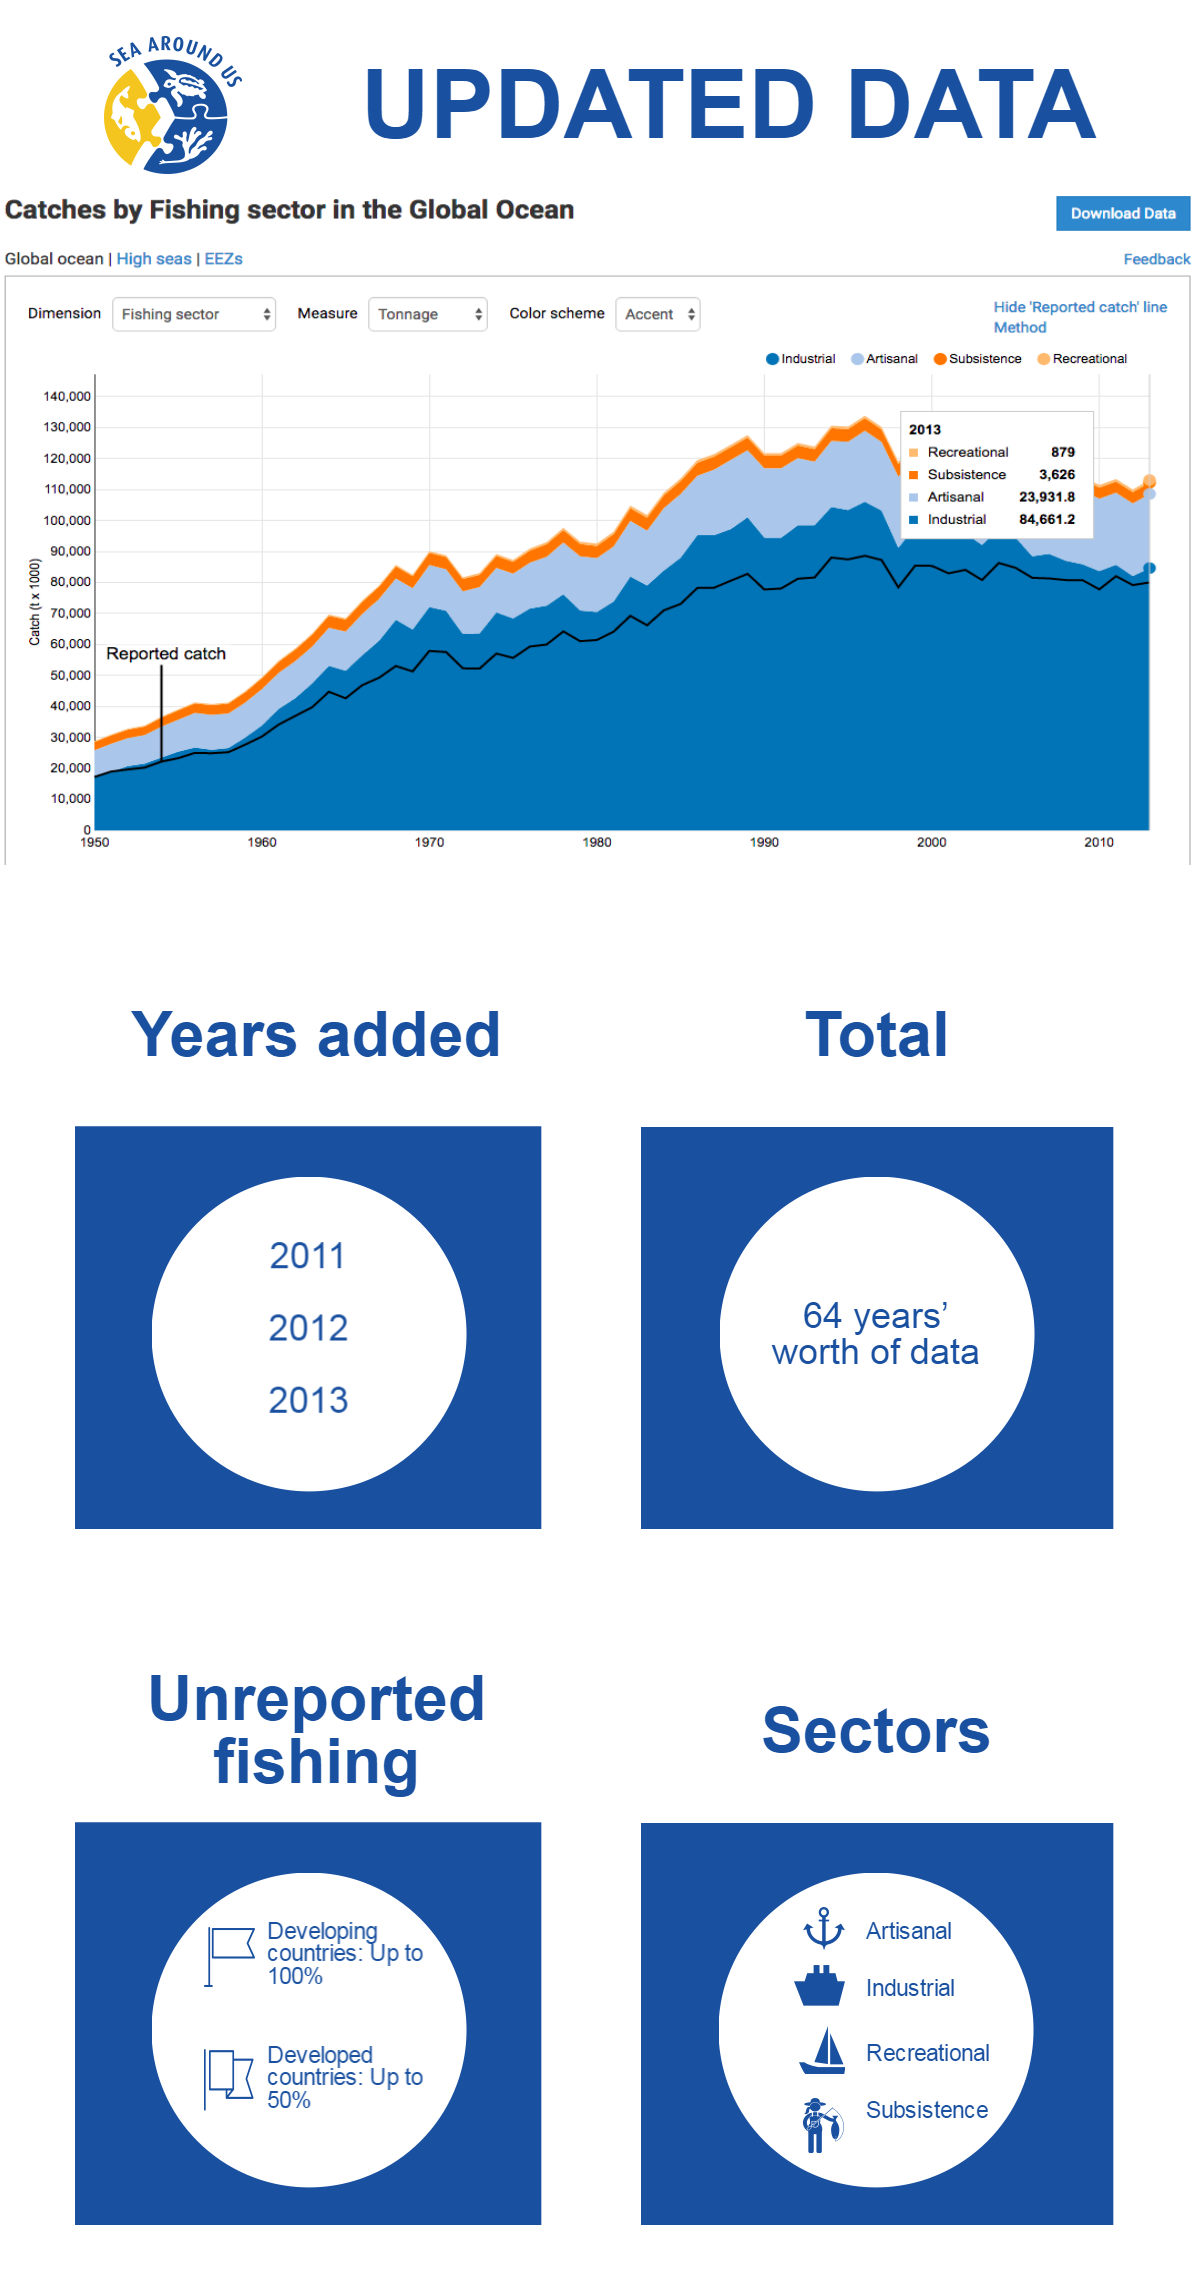
The Sea Around Us team is pleased to announce that the marine fisheries catch data and derived indicators on its website have been updated from 2010 to include information from 2011, 2012, and 2013.
This means that time series with 64 years’ worth of data (1950-2013) are available for free on www.seaaroundus.org, as is our catch mapping tool.
The documentation of data, methods, and assumptions made for this update will be presented for each country and territory in early 2017, after a further update to 2014 has been completed.
The Sea Around Us conducts reconstructions of catch data by complementing official information submitted by countries to the UN Food and Agriculture Organization with estimates of unreported catches obtained from a broad range of sources, including the peer-reviewed academic and grey literature, industrial fishing statistics, local fisheries experts, fisheries law enforcement, institutional reports, household and/or nutritional surveys, and other records such as documentation of fish catches by tourists.
The logic that justifies our method relies on the fact that due to a variety of reasons, from lack of proper statistical infrastructure in some countries to politically-motivated statistical manipulation in others, data provided to FAO by countries have underestimated fish catches by 30 to 50 percent in developed countries, and over 100 percent in many developing countries. In addition, unharmonized improvements in statistical systems in most countries (i.e., a country’s data become better and more comprehensive over time, but without retroactive adjustments for newly covered data) create statistical biases over time.
This underestimation and variable data bias obscure the average decline of 1.2 million metric tonnes per year in fish catches that the world has been experiencing since the mid-1990s, while simultaneously hindering the effective implementation of or changes to fisheries policy and management measures in many countries.
Thus, the Sea Around Us reconstructed data, which include reported and unreported industrial catches and difficult-to-track categories such as artisanal, subsistence, recreational, and illegal catches, as well as discarded fish, are invaluable resources that provide a more realistic picture of what is extracted from the world’s oceans.
Data can be searched by Exclusive Economic Zones, Large Marine Ecosystems, Regional Fisheries Management Organizations, High Seas, FAO Area, Fishing Country or users can get a Global overview. Once this basic selection has been done, data can be displayed choosing among different dimensions such as taxon, commercial groups, functional groups, fishing country, fishing sector, catch type and reporting status.
Users can also decide whether to see each of the aforementioned dimensions by tonnage or by landed value of catch in 2005 USD.
The Sea Around Us encourages the scientific and conservation communities, as well as the general public and official organizations, to download and make use of these data (given proper credits), and to provide feedback on how to further improve them. We value expressions of interests in collaborations to enhance country time series data.
The Sea Around Us initiative (a member of the Global Fisheries Cluster) is located at the University of British Columbia’s Institute for the Oceans and Fisheries, 2202 Main Mall, Vancouver, B.C. V6T 1Z4. Email us at feedback@seaaroundus.org