
Want to know where marine taxa that are part of the Sea Around Us global catch data occur around the world?
On our website we now offer taxon distribution maps that we use in our spatial allocation of global catches. Note that these distributions are based on the taxon distributions parameters as described in our methods. If you click on our mapping tool, there is now a tab that allows users to search for these taxon distributions — and see in what regions they are likely to occur. (Figure 1).
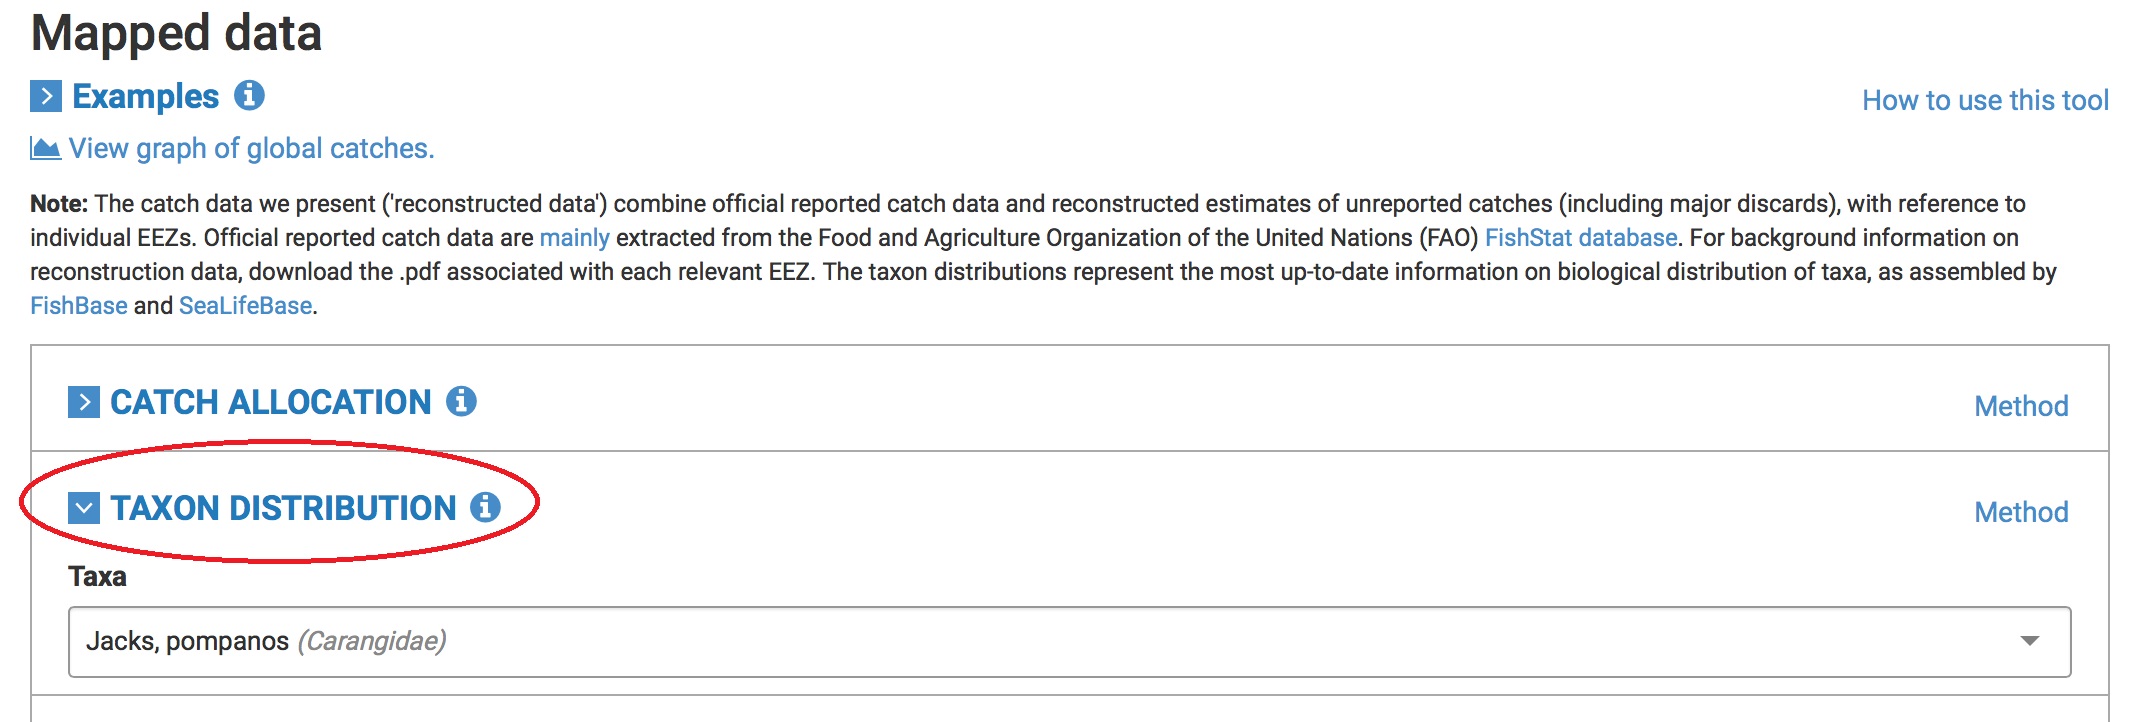
Figure 1. The taxon distribution tab is found within the mapping tool.
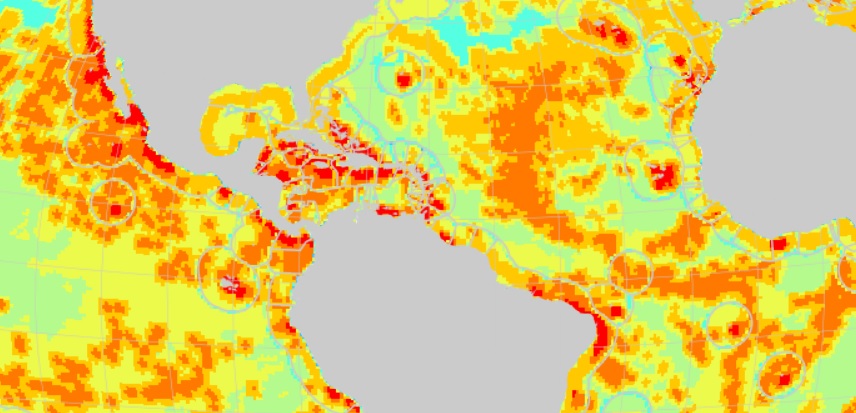
Similar to our catch allocation mapping tool, which shows where taxa are caught globally, the taxon distribution map uses the same colour scheme to illustrate the relative probabilities of a taxon’s biological distribution: Red indicates a high probability of occurrence, and, on the other end of the spectrum, blue denotes a low probability of occurrence.
Taxon distribution maps are rendered using a variety of data, with many being provided via our research partners FishBase (www.fishbase.org) and SeaLifeBase (www.sealifebase.org). Several geographic and ecological filters are applied, which includes the type of habitat species are found in — like coral reefs, estuaries, seamounts, continental shelves or slopes etc.. The methods used to derive these distributions should be consulted.
Figure 2 shows the distribution of jacks (family Carangidae), which is a cosmopolitan family.
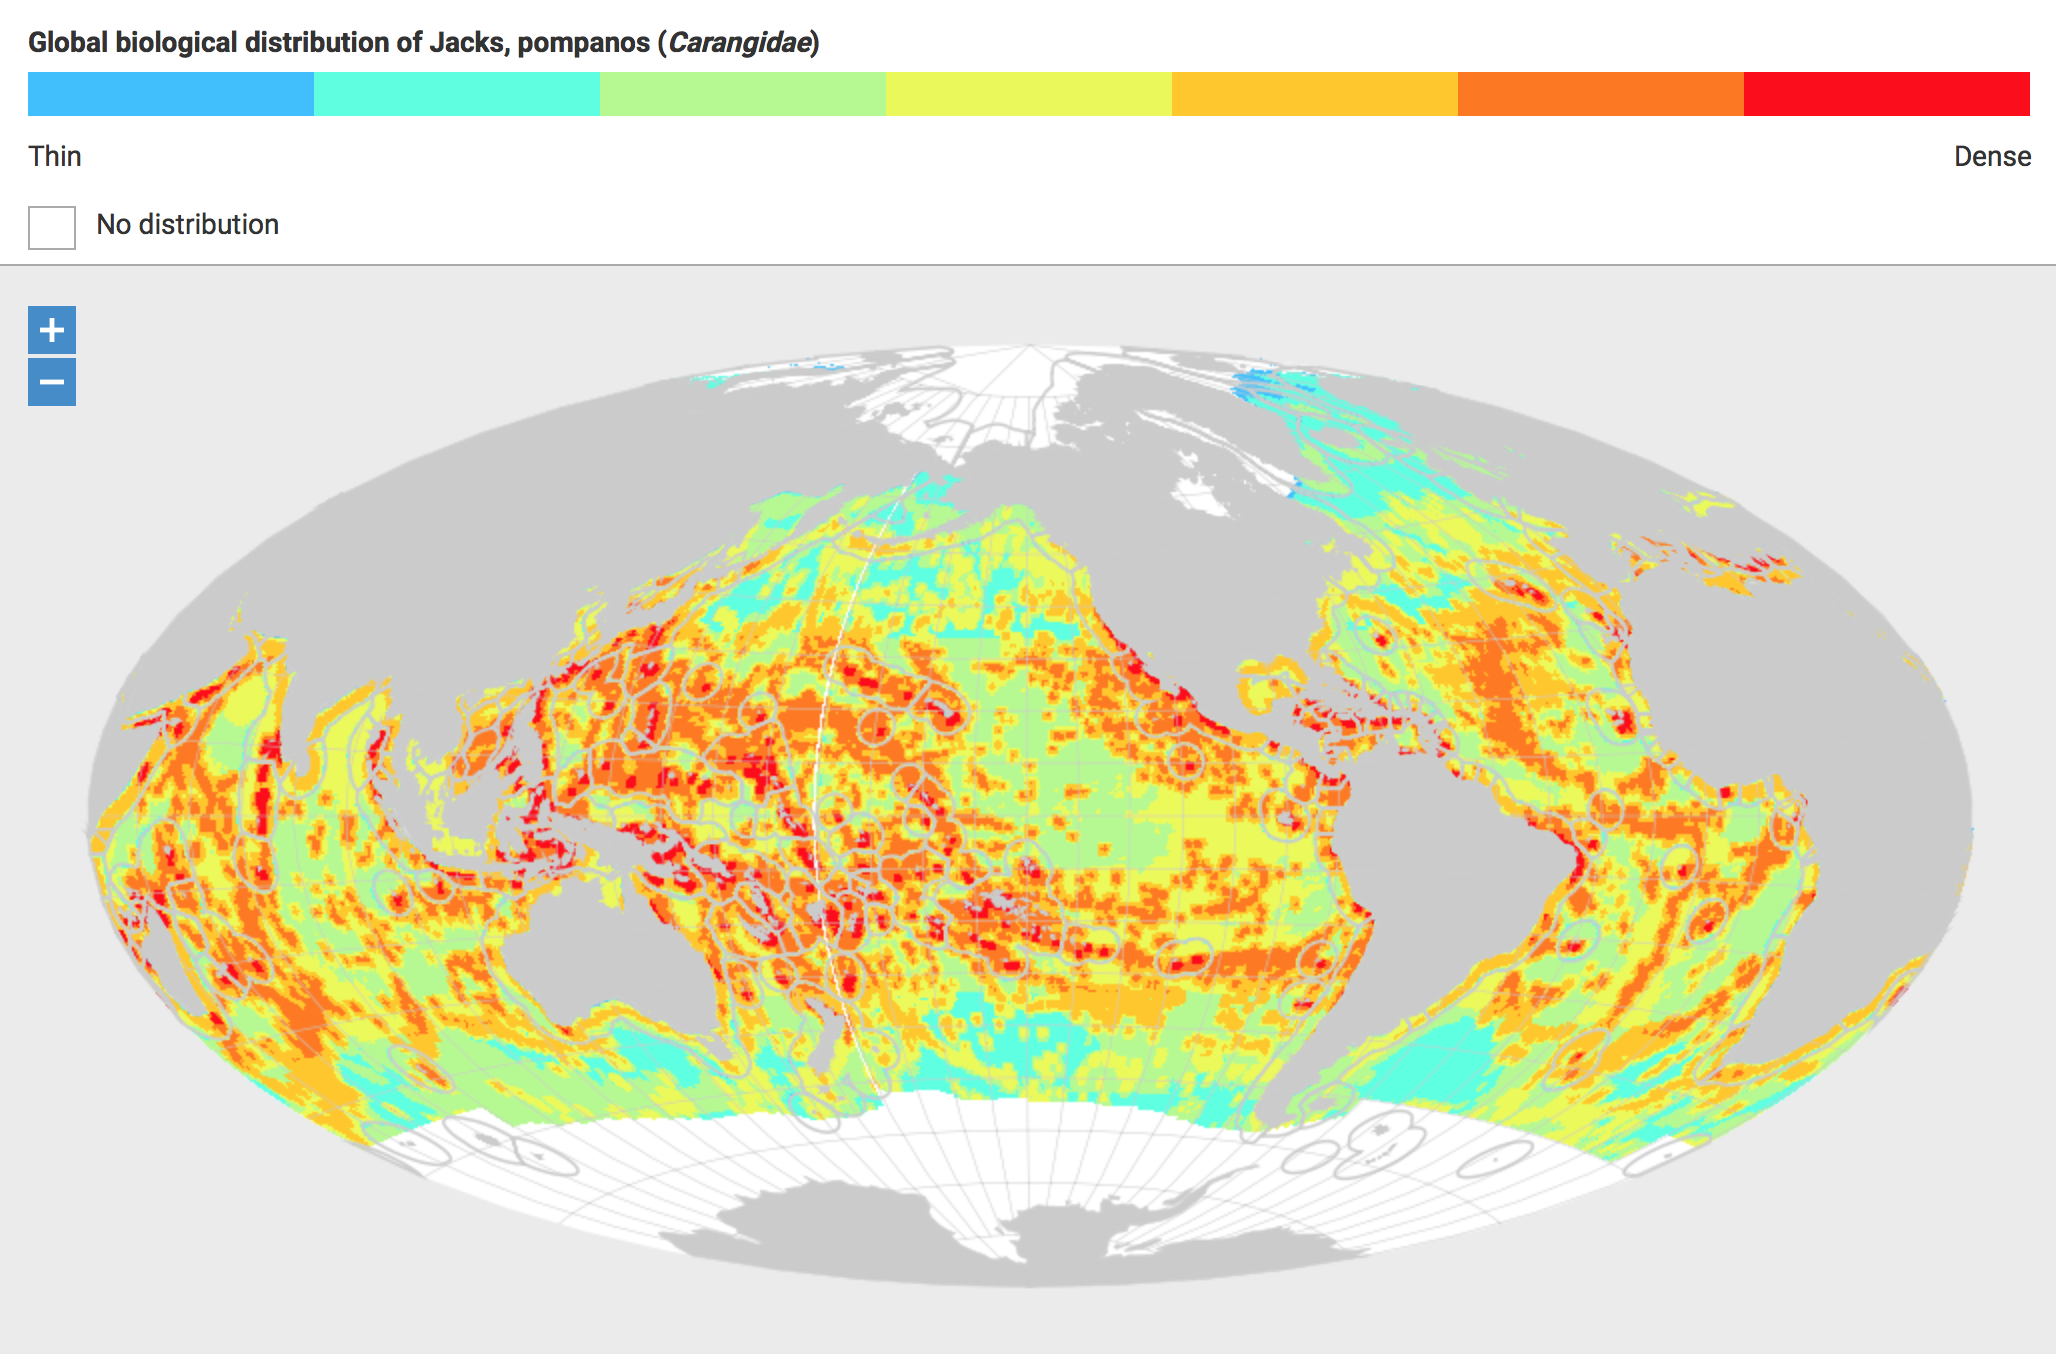
Figure 2. Taxon distribution map of Jacks (Carangidae)
Our taxon distribution maps are presented to allow users of our catch data to examine one of the key ingredients of our global catch data allocation.