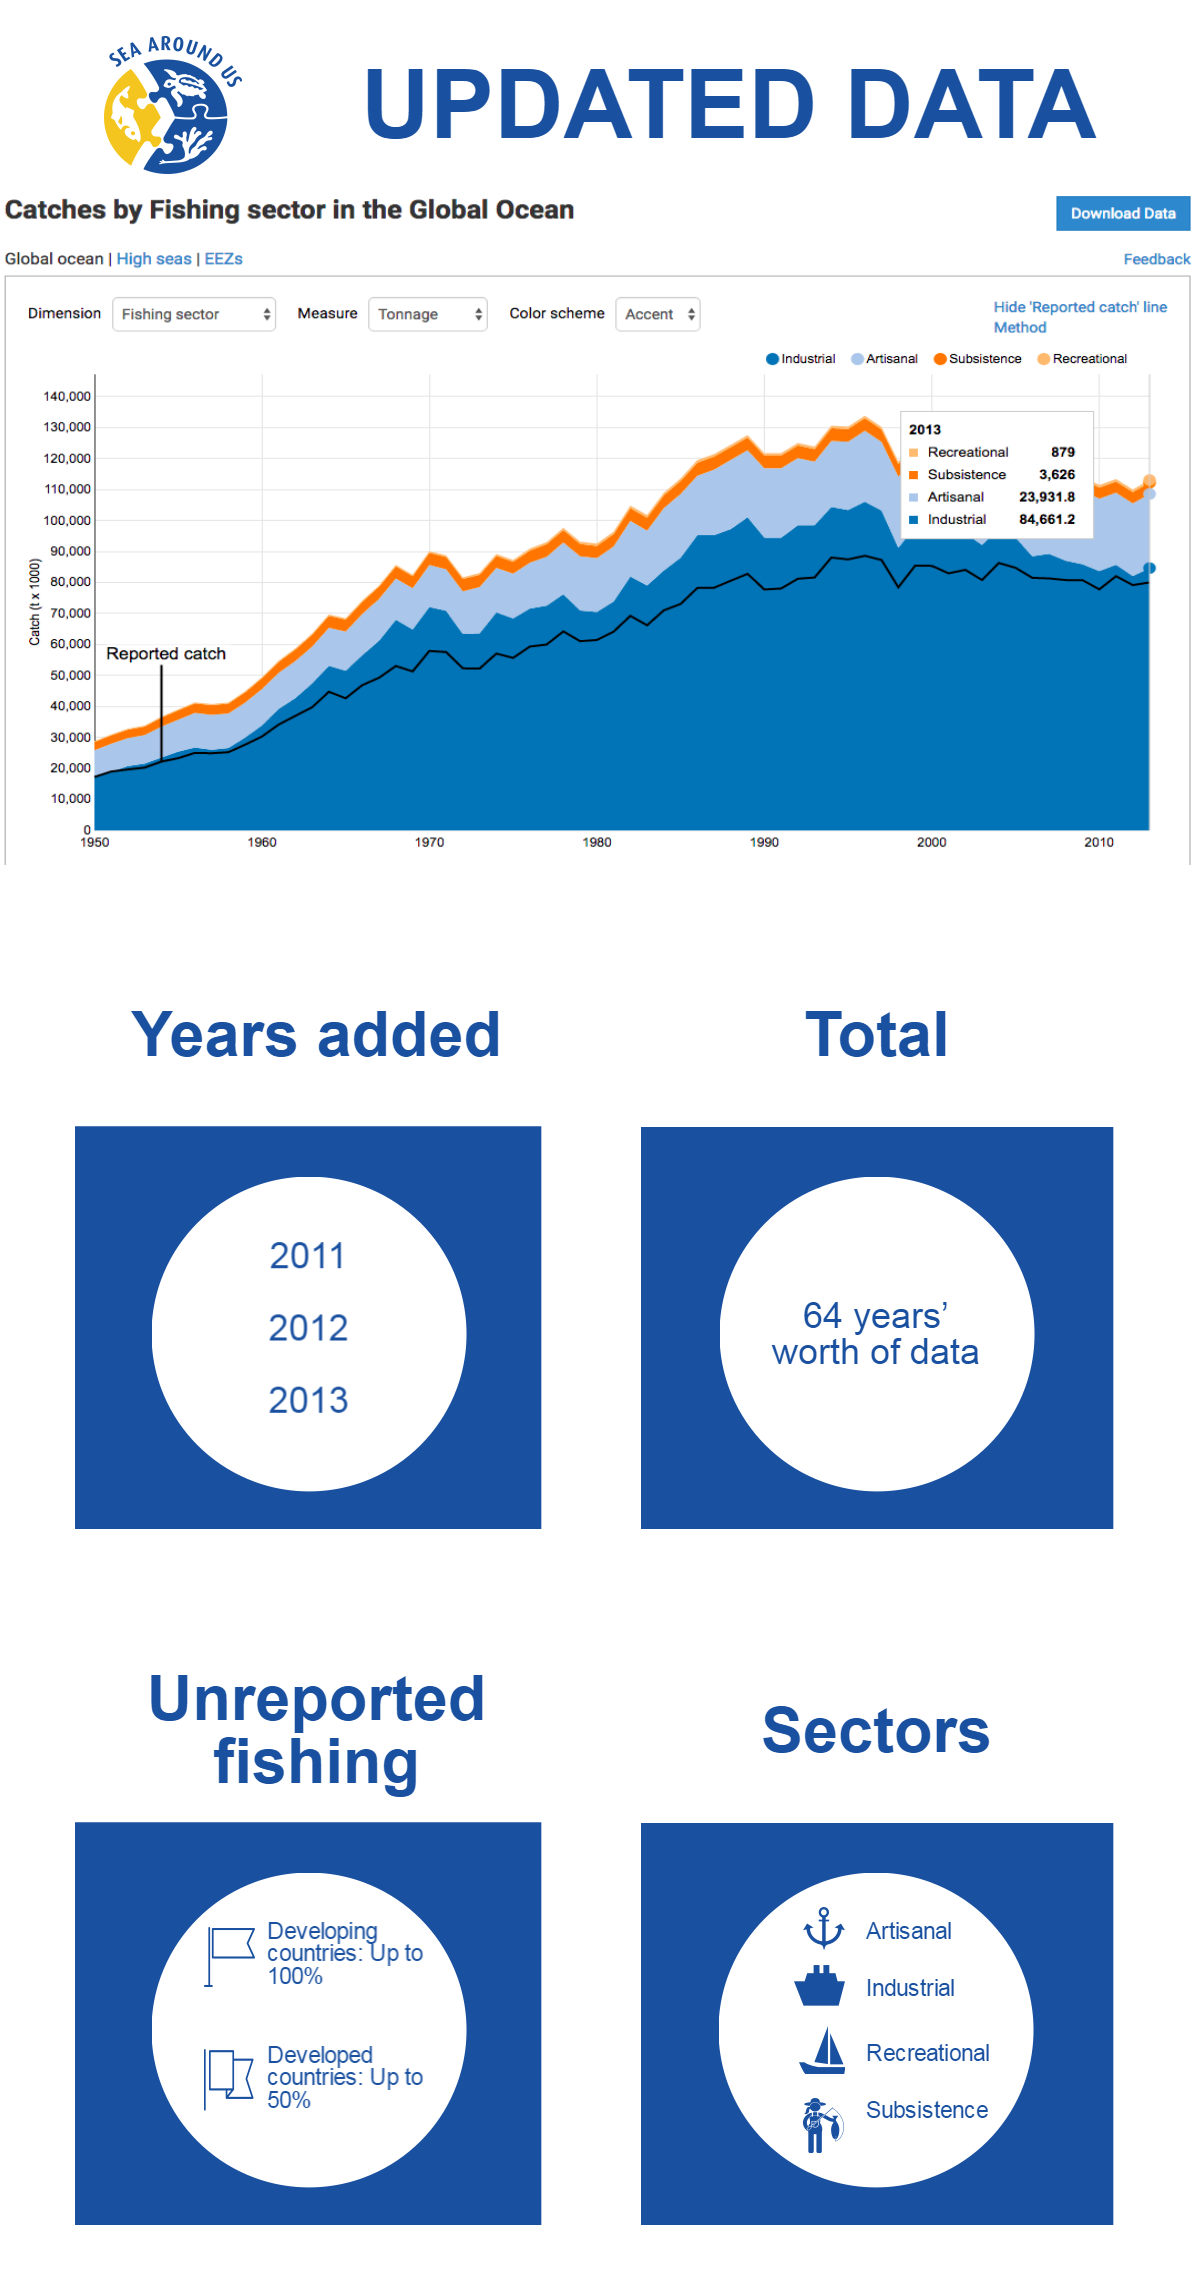
This means that time series with 64 years’ worth of data (1950-2013) are available for free on www.seaaroundus.org, as is our catch mapping tool.
The documentation of data, methods, and assumptions made for this update will be presented for each country and territory in early 2017, after a further update to 2014 has been completed.
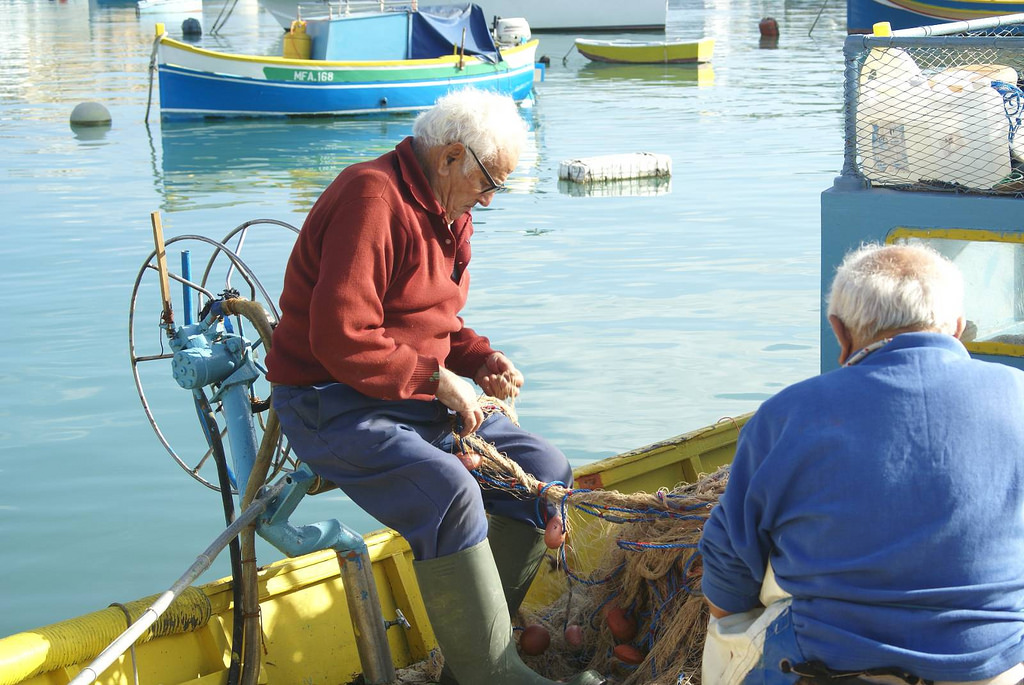
Fishermen in Żejtun, Malta. Photo by Ramon Casha, Flickr.
As the Sea Around Us team revealed in its 2016 Nature Communications paper, fish catches have been declining, on average, by 1.2 million metric tons per year since 1996.
This decline has resulted in lower per capita seafood availability and threatened food security in poor, developing countries. In fact, a group of scientists, among them the Sea Around Us Executive Director Dirk Zeller, has predicted that 11% of the global population could face micronutrient and fatty-acid deficiencies driven by fish declines over the coming decades.
That is 845 million people living with extremely low levels of iron, zinc or vitamin A.
“Considering nutrients found only in foods derived from animals, such as vitamin B12, and DHA omega-3 fatty acids (almost exclusively derived from meat consumption), we calculate that 1.39 billion people worldwide (19% of the global population) are vulnerable to deficiencies because fish make up more than 20% of their intake of these foods by weight,” the group has written.
There are many reasons why fish stocks are declining worldwide. However, and as the Sea Around Us principal investigator Daniel Pauly summarizes in the below video, at the root of the problem lies indiscriminate human activity.
Maria Ho has been with the Sea Around Us since October of 2014 and has, since then, been the right hand of Dr. Daniel Pauly and Dr. Dirk Zeller.
As their administrative assistant, she enjoyed being what she calls a “resource person” and populating their calendars back to back with talks, trips, Ph.D. defences, press commitments, lectures and so on. “I love coordinating events, conferences, and catering for meetings. I also enjoy proofreading work and editing text for publication. I like helping people,” she says.
Before joining the Sea Around Us at Institute for the Oceans and Fisheries, Maria held a similar job at BC Children’s Hospital for more than nine years. When she was considering joining the Sea Around Us, she knew that the change was going to be drastic, but there was something stronger pushing her to make the move. Continue reading →
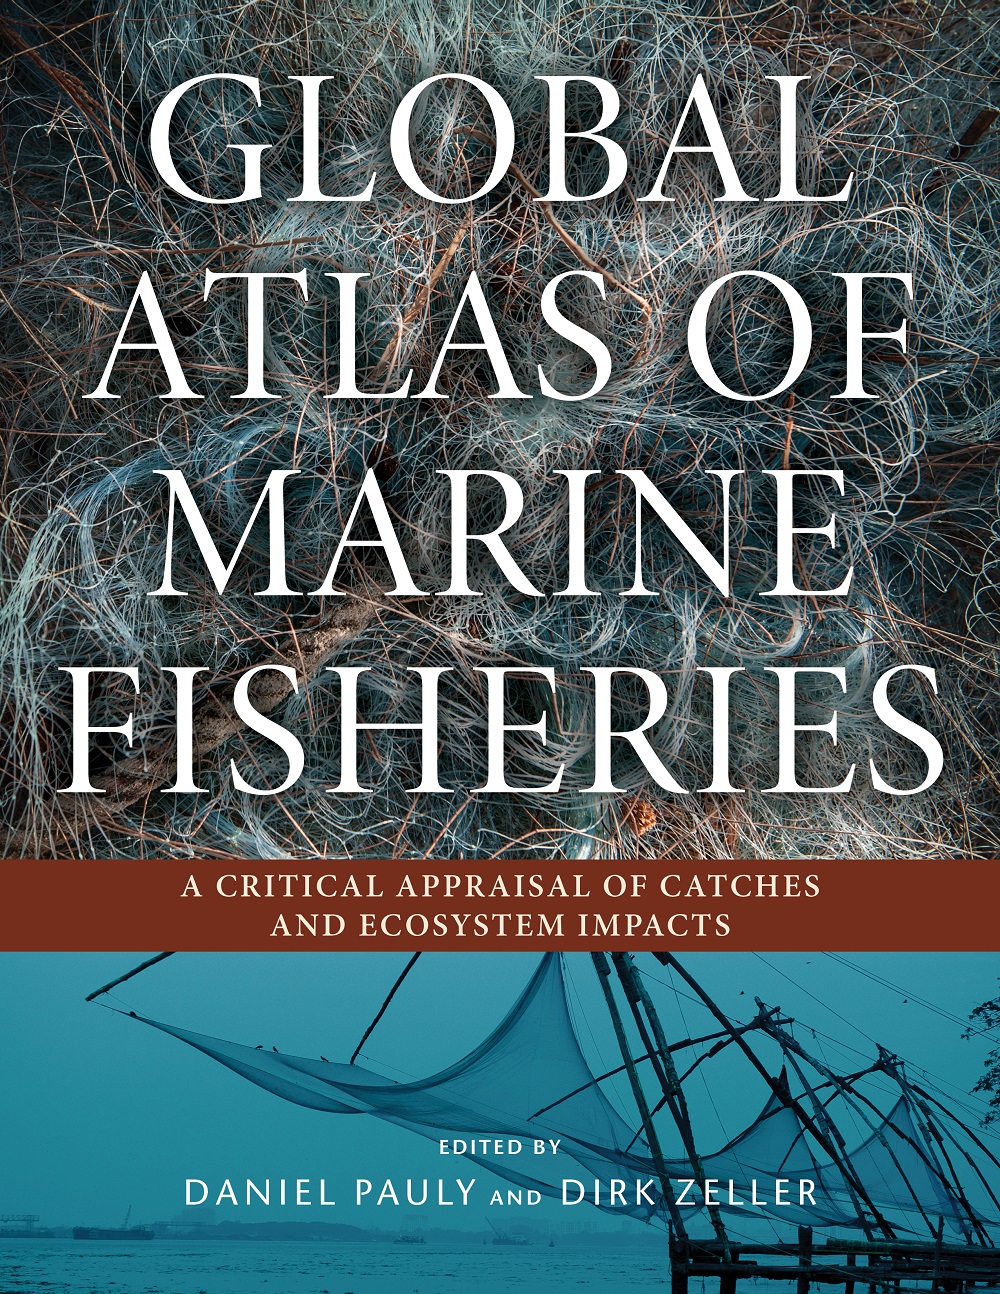
The Sea Around Us team recently launched the Global Atlas of Marine Fisheries, the first book to provide accurate, country-by-country fishery data.
In just a few months since it was released to the market by Island Press, the Atlas has become an indispensable resource for researchers, students, fishery managers, professionals in the fishing industry, environmentalists, and so on.
On the below video, Dr. Daniel Pauly, the Sea Around Us principal investigator, expands on the findings published in the book regarding reported vs. unreported global catch and the challenge of dealing with unreliable statistics from certain countries, among other topics.
As we mentioned in a previous post, last November Sea Around Us principal investigator Dr. Daniel Pauly was conferred the 2016 Albert Ier Grand Medal in the Science category.
In a ceremony held at the Maison des Océans in Paris, Pauly was handed the award by Albert II, Prince of Monaco, and M. Robert Calcagno, General Director of the Institute Océanographique.
Feeling hugely proud and very pleased by the honour, he said that the importance of the distinction is that it helps bring attention to the urgent issues affecting the world’s oceans.