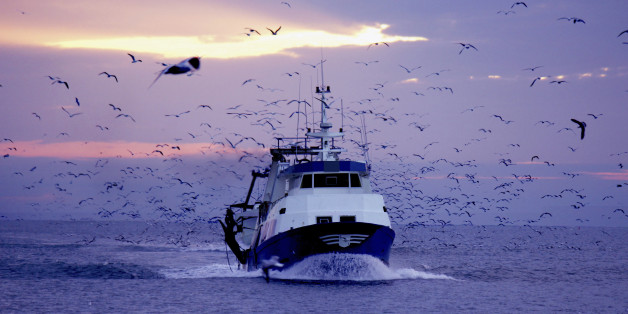
New Zealand fishery catch estimated at 2.7 times more than reported: study

gbi visit 21 8 04 015

The total amount of marine fish caught in New Zealand waters between 1950 and 2010 is 2.7 times more than official statistics suggest, according to the best estimate to date.

Unreported commercial catch and discarded fish account for most of the difference.

Fish of little or no perceived economic value have been routinely dumped at sea and not reported. Bycatch – fish caught along with the target species – is common and unavoidable. They’re routinely dumped, if unmarketable, under the minimum legal size, or the fisher has no quota.

The extended reconstructed estimate for 1950-2013 reveals an estimated 24.7 million tonnes of fish was unreported, compared to the 15.3 million t reported.

“This study is part of a wider New Zealand research project aimed at informing seafood industry efforts to become as economically and environmentally sustainable as possible,” said lead researcher Dr Glenn Simmons, from the New Zealand Asia Institute.

“To maintain sustainable fisheries and seafood businesses themselves, you need to know how much fish is being caught. There was already strong evidence that we didn’t know that, because the official statistics are incomplete.”

“Unreported catches and dumping not only undermine the sustainability of fisheries, but result in suboptimal use of fishery resources and economic waste of valuable protein.”

LOTS OF FISH ON DECK - SM-min

Dr Simmons and his team were among 400 researchers worldwide who collaborated on a landmark, 15-year long global “Sea Around Us” project at the Institute for the Oceans and Fisheries, University of British Columbia that sought to fill in the gaps left by official catch data.

The global results were published in the prestigious journal Nature Communications in February. The New Zealand results have now been published by the Institute for the Oceans and Fisheries, University of British Columbia.

Catch statistics that New Zealand and other countries report to the United Nations’ Food and Agriculture Organisation (FAO) do not include illegal or otherwise unreported commercial catches and discards. They also omit or substantially underreport fish taken by recreational and customary fishers.

The New Zealand researchers drew on an extensive body of documentation, including stock assessment reports, peer-reviewed literature, unpublished reports, and information obtained under the Official Information Act, as well as 308 confidential interviews with industry experts and personnel with first-hand knowledge and experience, of fishing and reporting practices. They combined this data with official catch data to statistically “reconstruct” a more comprehensive, robust catch estimate. The same method was used throughout the global series of studies.

The main New Zealand findings were:

– New Zealand’s reconstructed marine catch totalled 38.1 million tonnes between 1950 and 2010, which is 2.7 times the 14 million tonnes reported to the FAO.
– Since the Quota Management System (QMS) was introduced in 1986, the total catch is conservatively estimated to be 2.1 times that reported to the FAO.
– Unreported commercial catch and discards account for the vast majority of the discrepancy.
– Recreational and customary catch was 0.51 million tonnes, or 1.3 percent
– Only an estimated 42.5 percent of industrial catch by New Zealand flagged vessels was reported.
– 42 percent of the industrial catch was caught by foreign-flagged vessels, which dominated the catching of hoki, squid, jack mackerels, barracoota and southern blue whiting – some of the most misreported and discarded species.
– The extended reconstructed estimate for 1950-2013 is 40 million t, comprised of 19 million tonnes nationally reported, 5.8 million tonnes of invisible unreported landings, 14.7 million tonnes of unreported dumped commercial catch, and 549,000 tonnes of customary and recreational catches.

The findings also reveal how the QMS, despite its intentions and international reputation, actually undermines sustainable fisheries management by inadvertently incentivising misreporting and dumping, the researchers wrote in their report.

“A striking finding was the extent of misreporting to avoid deemed value penalties – at sea and on land. This highlights a weakness of the QMS, which relies on full and accurate reporting, yet, in practice, incentivises misreporting, which undermines the sustainability of fisheries. Fisheries management and stock assessment officials must spend more time talking and listening to the fishers themselves, observers and compliance officers.”

The evidence shows the QMS is in need of a robust critical review, along with consideration of alternatives to ensure the latest information, processes and technology are being utilized.

“Improving the transparency and reliability of fisheries data reporting is essential,” the researchers conclude in the report. “The future sustainability and certification of fisheries will depend on how the government addresses the under-reporting problems, which have long been a cause of concern.”

The researchers conclude that “Maori ought to play a greater role in fisheries management…they have a critical role to play in terms of Kaitiakitanga…over all New Zealand’s fishing sectors – recreational, customary, and commercial.”

Click here to view the paper.

Contact
Nicola Shepheard
Media Relations Advisor
Tel: 09 923 1515
Mob: 027 537 1319
Email: n.shepheard@auckland.ac.nz

NOTES TO EDITORS
– Landmark international study, led by Professor Daniel Pauly from the University of British Columbia, published in Nature Communications in February, ”reconstructed” estimates of global marine fisheries catches from 1950-2010, taking into account types of catches that are omitted or substantially underreported in official figures collated by UN Food and Agriculture Organisation (FAO)

– It found global catches peaked at 130 million tonnes in 1996, which is 51 per cent higher than the FAO figure of 86 million tonnes

– It also found a sharp decline from this peak, at more than three times the rate suggested by FAO figures

– Dr Glenn Simmons, of the New Zealand Asian Institute at the University of Auckland Business School, led a team of researchers who collaborated with Professor Pauly on the New Zealand research. Their report on New Zealand’s “reconstructed” catch is published on the Institute for the Oceans and Fisheries, University of British Columbia. The full list of authors is: Glenn Simmons*, Graeme Bremner, Hugh Whittaker, Philip Clarke, Lydia Teh, Kyrstn Zylich, Dirk Zeller, Daniel Pauly, Christina Stringer*, Barry Torkington, and Nigel Haworth* (* from the University of Auckland Business School)

Webinar May 17: The View Past Peak Catches: Global Catch Trends in Marine Fisheries

OpenChannelsLogo

On Tuesday May 17th Daniel Pauly and Dirk Zeller from the Sea Around Us will conduct a webinar through OpenChannels.org to discuss catch reconstructions, their recent paper in Nature Communications, and upcoming projects.

Event Date: Tuesday, May 17, 2016 at 1pm US EDT / 10am US PDT / 5pm UTC

To register, click here.

How much fish are we really catching from the world’s oceans? Catch data are important in fisheries research, but the availability of reliable and comprehensive catch data is often taken for granted. In a large number of countries, reliable catch data are not available, and the catch data these countries submit to the Food and Agriculture Organization of the United Nations (FAO) are incomplete and highly variable. Given the role of FAO in world fisheries, this means that many of the “big numbers” cited when talking or writing about global fisheries are erroneous. We present a “catch reconstruction” approach that we have applied to all maritime countries of the world to overcome this situation. (Read about this effort in the Nature Communications journal article “Catch reconstructions reveal that global marine fisheries catches are higher than reported and declining”.)

In this webinar, we will present our scientific approach, results from several countries illustrating the issues and problems, and the global results as presented in our recent paper. All materials and data for all maritime countries in the world (plus a wide variety of additional data and information items) are freely available for download at www.seaaroundus.org. We always welcome communications and feedback on our work and the data we present.

Webinar co-sponsored by MEAM, OpenChannels.org, and the EBM Tools Network.

Biodiversity of Sea Around Us catch data

The Sea Around Us Biodiversity tool gives users access to key information regarding taxa in our database.

When searching for information regarding Bigeye tuna (Thunnus obesus) in Australia’s EEZ, the following information is displayed:

BiodiversityBigeyeTuna

Other filters that can be used for the Biodiversity tool include LME, RMFO, FAO area, and High Seas regions, for each country; and also filters by taxon level and taxon group.

The Biodiversity tool pulls much of its information from the FishBase database.

Users can also find global catch data for each taxa. For example, below is the interactive graph for Bigeye tuna:

BiodiversityBigeyeTunaGraph

From the Sea Around Us Methods document:

“…there are 2,039 species level taxa in the Sea Around Us catch database (number subject to change over time), which currently belong to 262 genera, 187 families, 19 orders, 11 classes and 5 phyla.”

Fisheries Economics

The landed value of commercial fish in the Gambia, 2005

The landed value of commercial fish in the waters of the Gambia, 2005

If and how well a fishery is managed often depends largely on the economics of that fishery, and central to understanding the economics of a fishery are the availability of data.

The Sea Around Us, in collaboration with the Fisheries Economics Research Unit (FERU), has over the years built extensive datasets of economic information – like ex-vessel prices and subsidies data – which are being made available to policy makers and the public.

Many of the existing price databases today are either incomplete or unavailable to the public. Using the reconstructed catch data from the Sea Around Us, and the economic datasets assembled by FERU, the information we have is well-organized and easy to access.

Further, while the United Nations Food and Agriculture Organization (FAO) publishes processed and product fish prices, they do not present ex-vessel price, i.e., the price at first point of sale a fisher realizes upon sale of their catch. The Sea Around Us does include this price, thus allowing emphasis of the economic value on the core actors of the industry – the fisher.

Therefore, the landed values data the Sea Around Us presents via our website expresses the ex-vessel value (in US$) of the catch to the fisher (i.e., catch multiplied by ex-vessel price), and excludes added value through the economic value chain.

Fishers in Ha Long Bay, Vietnam. (Credit: Rafa Prada)

Fishers in Ha Long Bay, Vietnam. (Credit: Rafa Prada)

In partnership with FERU, work is ongoing to build and incorporate other economic datasets into the global database of the Sea Around Us.

As Dr. Rashid Sumaila, the Director of FERU writes: “To be able to devise management policies that appropriately take account of fisher behavior and thereby ensure the sustainability of fisheries resources, managers need to have a good knowledge of ex-vessel prices for the species under their management” (Sumaila et al., 2007).

Using our separate fisheries economics tool (bit.ly/1Z4ybDd), researchers and other interested users can find the time series (1950 to currently 2010) of landed values for the various different taxa in the catches from EEZ’s and LME’s. And, by having landed values, Sumaila writes, researchers can better determine the “local, regional and global economic and social impacts of different management policies.”

But the Sea Around Us and FERU also provide another core economic dataset: Data on fisheries subsidies.

While some subsidies can be beneficial to fisheries; Sumaila found, in another paper, that the “amount of subsidies provided by governments of the world to their fishing sector is quite large and that most of these subsidies lead to overcapacity and overfishing.”

With our fisheries economics tool, researchers can examine the amount of money that countries spend on fisheries subsidies, broken down into categories like fisheries services, research and development, tax exemptions and fuel subsidies, among many others.

And more importantly, we also determine whether the subsidies that are used are ‘beneficial,’ ‘harmful,’ or ‘ambiguous,’ the latter meaning it is not always straight forward to determine the effects of the subsidy.

This information is all directly and easily accessible for researchers, NGO’s and governments to use.

References:

Sumaila, U. R., Marsden, A. D., Watson, R., & Pauly, D. (2007). A global ex-vessel fish price database: Construction and applications. Journal of Bioeconomics 9(1), 39–51.

Sumaila, U.R., Khan, A., Duck, A., Watson, R., Munro, G., Tyedmers, P. & Pauly, D. (2010). A bottom up re-estimation of global fisheries subsidies. Journal of Bioeconomics 12:201–225.