
Turau via Getty Images
By Daniel Pauly
To manage the fisheries in their Exclusive Economic Zones (EEZs), countries need to know their catch. Ideally, countries (i.e., their department of fisheries or equivalent agencies) would know much more—size and productivity of the stocks being exploited, economics of the fisheries, etc.—but it is essential to know about catch as the goal of a fishery is to generate and maintain a catch, and if possible, to increase it.
The Food and Agriculture Organization of the United Nations (FAO) does maintain a publicly available database of fisheries statistics, based on submissions by its member states, but this covers only landings (i.e., it omits discarded bycatch), does not identify the EEZs where the landings come from, doesn’t present the data by sectors (i.e., industrial, artisanal, subsistence and recreational) and doesn’t estimate the illegal and otherwise unreported and undocumented (IUU) catches usually generated by roving distant-water fleets.
A publicly accessible database that builds on the FAO statistics but overcomes the deficiencies mentioned above has now been created (at www.seaaroundus.org) which covers the fisheries of all maritime countries and territories of the world, from 1950 to 2010, and will be regularly updated. It is based on historic catch reconstructions by about 400 colleagues throughout the world, a decade-long support of the Sea Around Us by The Pew Charitable Trusts, and the technical wizardry of programmers at Seattle-based Vulcan Inc., which complemented a two-year grant from the Paul G. Allen Family Foundation.
The database, which also presents catch-related data and indicators (e.g., ex-vessel values of catches, different types of subsidies received by the fisheries of each country, stock-status plots) allows managers, scientists, students or ocean activist to find out how much is caught of the EEZ of each country and territory, by species or group of species, by sectors, by catch type (discarded or retained), and thus to acquire an understanding of the fisheries that was impossible to obtain previously, and which should help toward an improvement of their management. The data underlying the interactive graphic displays can be downloaded for further analysis.
All information on marine biodiversity in that database is derived from FishBase (www.fishbase.org) for fishes and from SeaLifeBase (www.sealifebase.org) for invertebrates. These recognized online encyclopedias are closely linked to www.seaaroundus.org, and so allow for acquiring more information on exploited species.
Additionally, the database has a spatial expression, i.e., the catch data it contains have been plotted in space using knowledge of the global distribution of exploited fish and invertebrates (from FishBase and SeaLifeBase) and of the fisheries that rely on them. The result is that catch maps can be produced, by (group of) species and/or countries, showing, for example, how fisheries have expanded geographically from 1950 to the present.
As mentioned above, this database does not provide all the key information required to manage fisheries; notably, it lacks time series of biomass (i.e., the weight is of the fish left in the sea). We have plans to overcome this deficiency in the next few years. In the meantime, however, we hope that the interactive graphs and maps that can be viewed on, and datasets that can be downloaded from, www.seaaroundus.org will contribute to a better understanding of marine fisheries. For example, using this database, we could recently demonstrate that the world marine fisheries catches are about 50% higher than suggested by the FAO statistics (which can be viewed as a good thing, since it implies the oceans are more productive than we thought), but have been declining rapidly since 1996, which is definitely an issue that needs to be addressed.
This was just one example of what can be done with our database and website. We hope that these tools, moreover, will be questioned by empowered users, and that their feedback will gradually improve both. We also hope that, in the process, our website will become a relied upon one-stop go-to place for information on marine fisheries, and will thus contribute, via their improved management, to the incomes and food security of the millions of people who depend on fish.
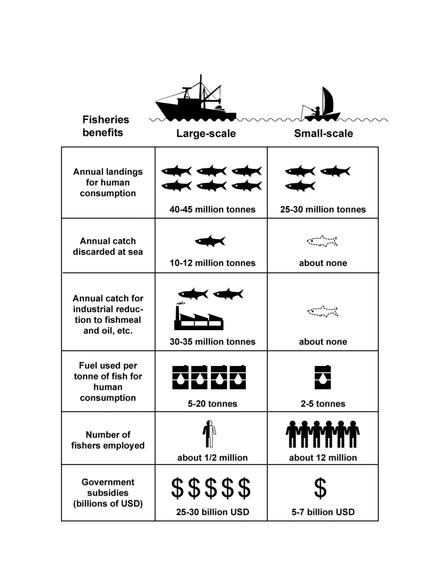
The database described here allow time contrasting, for the first, the performance of large-scale (industrial) and small-scale (artisanal and subsistence) fisheries on a global basis. The definitions of large-scale (‘industrial’, often mislabeled ‘commercial’) and small-scale (often mislabeled ‘traditional’) are those prevailing in each maritime country. Governments tend to favor industrial fisheries, although it is the small-scale fisheries with meets most of the sustainability criteria.
The original article in the Huffington Post can be found here.