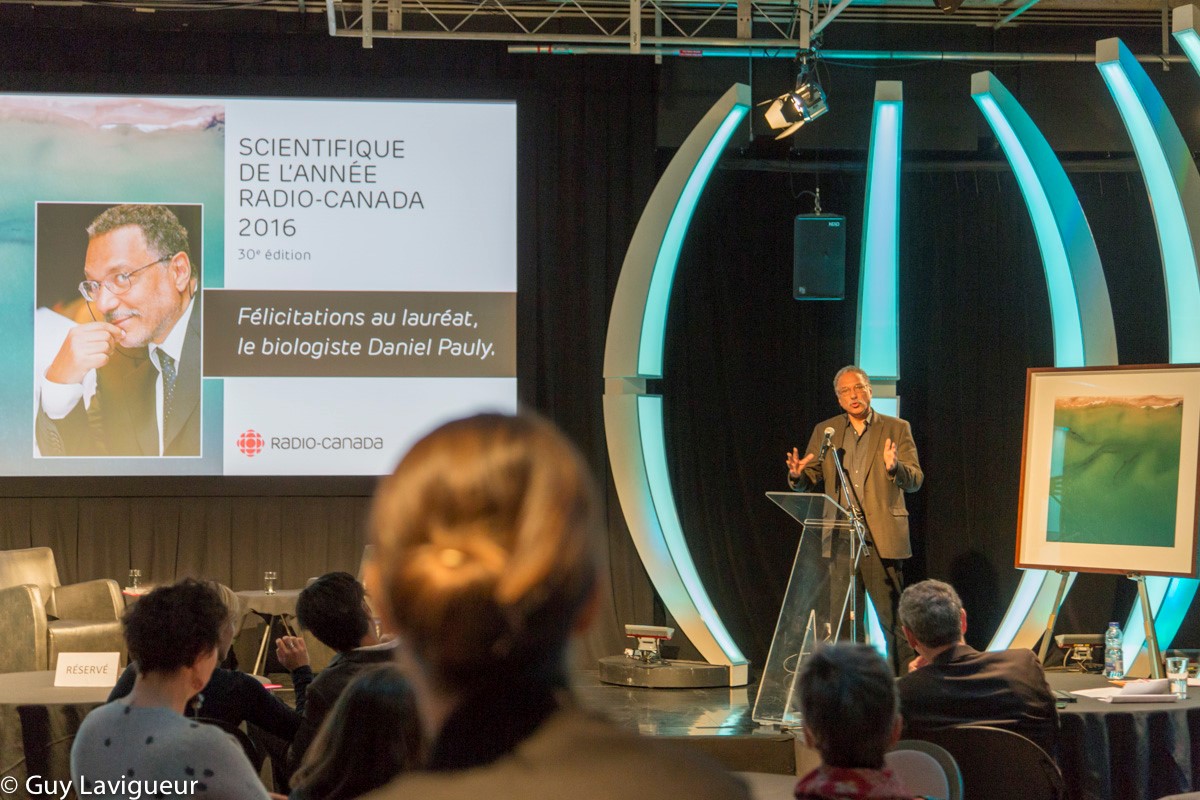
“C’est un honneur,” the Sea Around Us Principal Investigator and UBC Killam Professor with the Institute for the Oceans and Fisheries, Dr. Daniel Pauly said after Radio Canada’s Les Années-lumière named him “Scientist of the Year.”
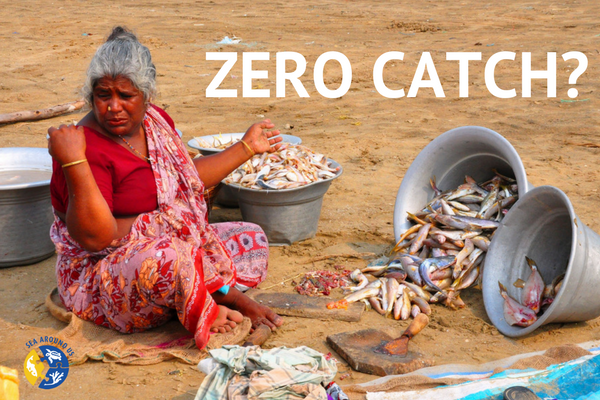
Pauly is being recognized for his lifelong research efforts on the human impacts on global fisheries, which hit a high note in 2016 with two major publications, both co-authored with Dirk Zeller: The Nature Communications paper “Catch reconstructions reveal that global marine fisheries catches are higher than reported and declining” and the Global Atlas of Marine Fisheries, released by Island Press.
Yanick Villedieu, host of Les Années-lumière, explained that the award aims at highlighting the work of a French-speaking scientist who, throughout his/her career but particularly in the past year, had a major discovery, achievement, or publication of national and international significance.