
Project Overview
The Sea Around Us is an international research initiative at the University of British Columbia, which acts as a critical resource to assess the impact of fisheries on marine environments. Since 1999, SAU has been collecting fisheries-related information from every maritime country from 1950 up to now. This set of information is used to reconstruct fisheries catch data from 1950. This project was elaborated to facilitate the access to these catch data, beyond what is made available on the website.
Catch data are viewed by government subsidiaries, marine biodiversity and is available on their website. Since the data presented through the website is vast and complex, when large database queries are made, or multi-dimensional charts are rendered, the website may slow down or become unavailable. Moreover, the Sea Around Us database team also needs to take care of the customized data requests sent by scientific colleagues, members of the conservation community, NGOs, and other researchers. Sea Around Us seeks to improve data access, avoid time delays, and provide a better user experience to enhance meaningful analysis and research, broadening the impact of this valuable dataset.
To improve the access and enhance the research done using the Sea Around Us website, UBC Cloud Innovation Center is able to provide a solution that offers a new way to interact with and derive insights from the SAU dataset by leveraging AWS services and Jupyter notebooks in a server-less fashion. The proposed solution involves AWS services such as Amazon Relational Database Service (RDS), AWS Glue, Amazon Athena, Amazon Simple Storage Service (S3), and Amazon CloudFront to generate and access a subset of SAU data for further analysis. Generation of subset data is done only once or twice a year or when there is a significant change in data. On a day-to-day basis, this subset of data in S3 is loaded into Jupyter notebooks (via CloudFront) for further analysis and visualizations. This enables power users and analysts to perform data analysis or create custom visualizations as needed within the notebook itself, reducing and potentially replacing the need of using the SAU for obtaining analytical information. Monitoring the solution utilization can be done via CloudFront statistics. Logs set up for the distribution can be used to monitor and analyze popular objects, usage by location, and to track the trends in requests and data transfer.
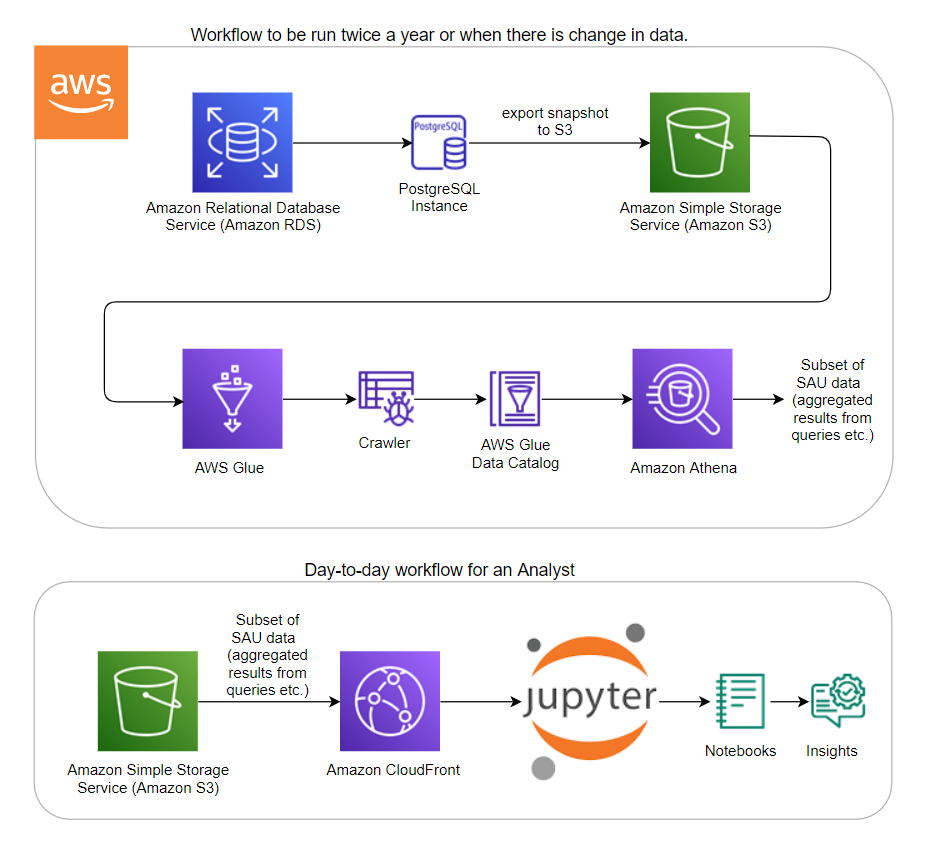
As seen in the architecture diagram below:
- The first part of the workflow involves exporting the snapshot of the Sea Around Us PostgreSQL database (filtered to only the necessary tables) to S3.
- Then the metadata of this data is captured with the help of Glue crawlers.
- The data in S3 is now ready to be queried from Athena in a server-less fashion.
- When the queries are run on Athena, CSV files are automatically generated in relevant folders on S3. This is the subset of SAU data highlighted in the architecture diagram below, and this subset of data includes aggregated results from SQL queries.
- In the second part of the workflow (the day-to-day scenario), an analyst or a power user can load this subset of SAU data in S3 (via CloudFront) from S3 into Jupyter notebooks in any environment for further analysis and visualizations – generating insights from data.
The solution enables researchers and analysts to perform data analysis or create custom visualizations as needed within the notebook itself, reducing and potentially replacing the need of using the SAU’s website for obtaining analytical information. More importantly, this solution has the potential of offloading 80% of customized data requests ( 8 customized data requests per month) from the Sea Around Us database team. Such requests usually come from scientific colleagues, members of the conservation community both national and international (for example, World Wildlife Fund and NGOs involved in SDG 14 Life Below Water), graduate students, and other researchers.
High level Architecture Diagram
How To Start
Other links with explanations
Concepts, definitions and methods: https://www.seaaroundus.org/tools-guide/
GitHub – Repository: https://github.com/SeaAroundUs/sau-ubc-cic-catchdata