On using catches to predict abundance

Factions among the fisheries community disagree on whether catch data – the amount of fish drawn from the sea – can be used to assess the health of fish stocks. In a comment piece published in Nature today, the Sea Around Us Project’s Principal Investigator Daniel Pauly shares his views, emphasizing that catch data are often the only type of data we have to tell anything about the status of fisheries.

While developed countries such as the US, Australia and those in Europe are able to use a variety of data, such as size, growth and migration information, as well as survey data, to conduct expert stock assessments, Pauly points out that these come at a cost: anywhere from US$50,000 to millions of dollars per stock. Such costs are not feasible for the majority of developing countries. Furthermore, for 80% of maritime countries, catch is the only data available.

In a second comment piece, Ray Hilborn and Trevor Branch from the School of Aquatic and Fishery Sciences, University of Washington, argue that there are other factors beyond the health of a fish stock that can account for changes in catch. Used on their own, catch data can create confusion and alarm about the abundance of fish stocks, they say.

Pauly agrees that catch data should be used with caution, but adds there is danger in undermining the value of this information. In most countries, the amount of fish caught is the only information available to assess stock health. “If resource-starved governments in developing countries come to think that catch data are of limited use, the world will not see more stock assessments; catch data will just stop being collected,” says Pauly.

The Sea Around Us Project, under the guidance of Pauly, is currently conducting a global evaluation of catch data, from 1950 to present, collated by the Food and Agriculture Organization (FAO) of the United Nations. Results so far reveal that many countries have underreported their catches. The extent of the underreporting is larger in developing countries (about 100-500%; Zeller et al. 2007) than in developed ones (30-50%; Zeller et al. 2011).

To see the full article, please go online to Nature.com: Pauly D (2013) Comment: Does catch reflect abundance? Yes, it is a crucial signal. Nature 494: 303-305.

Zeller D, Booth S, Davis G and Pauly D (2007) Re-estimation of small-scale fisheries catches for U.S. flag island areas in the Western Pacific: The last 50 years. Fishery Bulletin 105: 266-277.

Zeller D, Rossing P, Harper S, Persson L, Booth S and Pauly D (2011) The Baltic Sea: estimates of total fisheries removals 1950-2007. Fisheries Research 108: 356-363.

New database of marine aquaculture launched

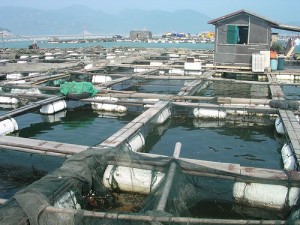
The new Global Mariculture Database (GMD), released by the Sea Around Us Project, offers detailed information on the where and what of mariculture around the world since 1950. By mapping the production of marine aquaculture at smaller scales than the usual national scale and by digging deeper into the species being farmed, the GMD provides room for new insights into marine aquaculture.  And all of this information is now available online for anyone to browse on the Sea Around Us Project website!

The GMD confirms reports by the Food and Agriculture Organization of the UN (FAO) that the amount of seafood produced by marine aquaculture has tripled since 1950 – a massive increase. During this time, there has also been a shift in the type of seafood produced globally, with a larger percentage of predatory species, such as salmon and tuna, farmed around the world today compared to 1950. In the past, the relative production of species lower on the food chain, like mussels and oysters, was higher. This phenomenon has been described as “farming up the food web” a term derived from the concept of fishing down marine food webs.

In keeping with the Sea Around Us Project’s goal of improving public access to global fisheries and aquaculture information, this Global Mariculture Database (GMD) is freely available online at www.seaaroundus.org.

To find out more about the GMD and how it was created, you can read the paper recently published in the journal Marine Policy:

Campbell B and Pauly D (2012) Mariculture: a global analysis of production trends since 1950. Marine Policy 39: 94-100.

Fish Farms from Space: The Ground Truth from Google Earth

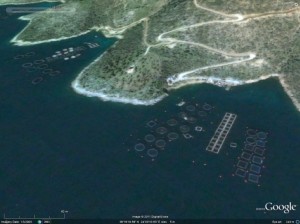
The Great Wall of China is not the only thing you can see from space. Fish farming cages are clearly visible through Google Earth’s satellite images and University of British Columbia researchers have used them to estimate the amount of fish being cultivated in the Mediterranean.

The study, published yesterday in the online journal PLoS ONE, is the first to estimate seafood production using satellite imagery.

“Our colleagues have repeatedly shown that accurate reporting of wild-caught fish has been a problem, and we wondered whether there might be similar issues for fish farming,” says lead author Pablo Trujillo, an Oceans Science Advisor for Greenpeace International, who conducted the study while a research assistant at the UBC Fisheries Centre.

“We chose the Mediterranean because it had excellent satellite coverage and because it was of personal interest,” says Chiara Piroddi, co-author and an ecosystem modeler at the UBC Fisheries Centre. “We hand counted 20,976 finfish cages and 248 tuna cages, which you can differentiate due to their extremely large size – each tuna cage measured at more than 40 metres across.”

Almost half the cages were located off the coast of Greece and nearly one-third off of Turkey – and both countries appear to underreport their farmed fish production. The researchers note that not all areas had full satellite coverage – for instance, images were missing for large portions of the coasts of France and Israel, for reasons the authors do not fully understand.

Combining cage counts with available information on cage volume, fish density, harvest rates, and seasonal capacity, the research team estimated ocean finfish production for 16 Mediterranean countries at 225,736 tonnes (excluding tuna). The estimate corresponded with government reports for the region, suggesting that, while there are discrepancies at the level of individual countries, overall, the Mediterranean countries are giving accurate counts.

“The results are reassuring, and the methods are inspiring,” says co-author Jennifer Jacquet, a post-doctoral researcher with UBC’s Sea Around Us Project. “This shows the promise of Google Earth for collecting and verifying data, which means a few trained scientists can use a freely available program to fact-check governments and other large institutions.”

Trujillo adds that Google Earth, with its high-resolution images and consistent time series, can be a powerful tool for scientists and non-governmental organizations to monitor activities related to ocean zoning and capture fisheries.

See some coverage of the work at The Scientist.

Analysis of FAO Report on Fisheries Statistics

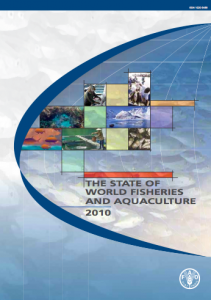
Global fisheries statistics must be viewed with a critical eye. Fisheries landings data are collated by FAO and contributed by all member countries, which have varying resources and motives. In a new paper recently published in Marine Policy, Daniel Pauly and Rainier Froese take a close look at FAO’s State of the Worlds Fisheries and Aquaculture’ (SOFIA) report from 2010 and discuss the FAO’s history, as well as the implications, imperfections, and possible improvements to be made to fisheries data.

Pauly and Froese are both complimentary and critical. They point out the misleading use of the word ‘stability’ in the report as it refers to global catch data from 2005-2008, and point out that even if that global catches are indeed stable, fishing effort is rapidly expanding. They note the FAO’s acceptance of scientific data that showed China does not know how much its fisheries catch, and the large degrees of uncertainty around global trends this problem creates. Pauly and Froese point approvingly to SOFIA’s position on assemblage overfishing and their statement: ‘ We do not disagree that a general decline in mean trophic level of marine landings is likely to have occurred in many regions.’ Finally, Pauly and Froese call for cooperation between institutions, e.g., U.N. technical organization and civil society, as represented by universities and non-government organizations, to improve SOFIA reports and potentially the management of fisheries globally.

To read the full article click here.

Citation: Pauly, D. & Froese, R. 2012. Comments on FAO’s State of Fisheries and Aquaculture, or ‘SOFIA 2010’ Marine Policy 36: 746-752.

Global fishing effort increasing and underestimated

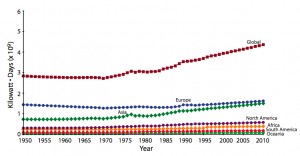
A new study by Sea Around Us Project members examines the global trends in fishing effort from 1950 to 2006 using FAO fisheries data. The analysis confirmed global fishing effort is increasing and that effort is led by Europe and Asia. Trawlers contribute a major fraction of global fishing effort, as do vessels greater than 100 gross registered tons. But the study also notes that there are many limitations to the data, such as the absence of effort data for many countries and the issue of illegal, unreported, and unregulated fishing. This means that the World Bank estimate of $50 billion in fisheries losses due to overcapacity is conservative.

Full citation: Anticamara, J.A., R. Watson, A. Gelchu and D. Pauly. 2011. Global fishing effort (1950-2010): Trends, gaps, and implications. Fisheries Research 107: 131-136.