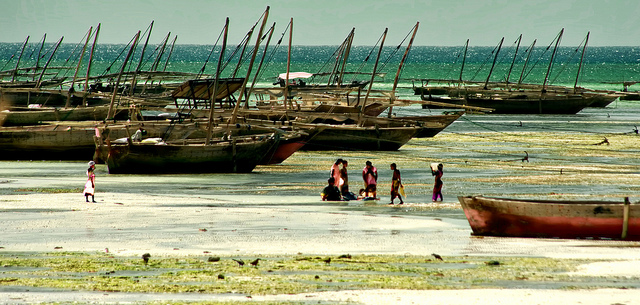
(Photo Credit: giampiero Ridella, via Flickr)
Near the coast of Tanzania it’s not uncommon to hear large explosions reverberate across the water. Continue reading

(Photo Credit: giampiero Ridella, via Flickr)
Near the coast of Tanzania it’s not uncommon to hear large explosions reverberate across the water. Continue reading
 The Batsheva de Rothschild fund supports the annual Batsheva Seminars held in northern Israel, covering topics in science with leading experts from Israel and abroad.
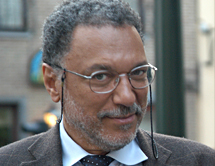
Daniel Pauly attended the seminars between November 16-19, giving a lecture titled: “The impact of industrial fishing on the world’s marine ecosystems.”
The full video can be found here, and then under the heading “Fisheries, invasive species and marine conservation.”
Windows Media Player is required.
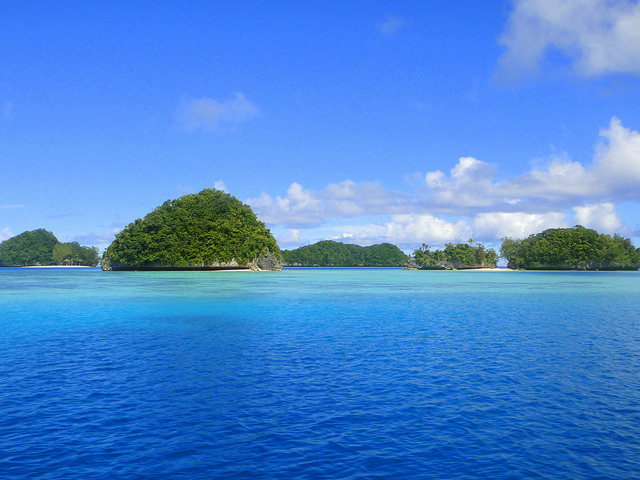
Credit: Matt Kleffer, via Flickr
In 2010 the United Nations set a goal to preserve 10 percent of the ocean by 2020. Research has shown that when waters are protected, fish supply and biodiversity greatly improve. This leads to more sustainable fisheries. Continue reading
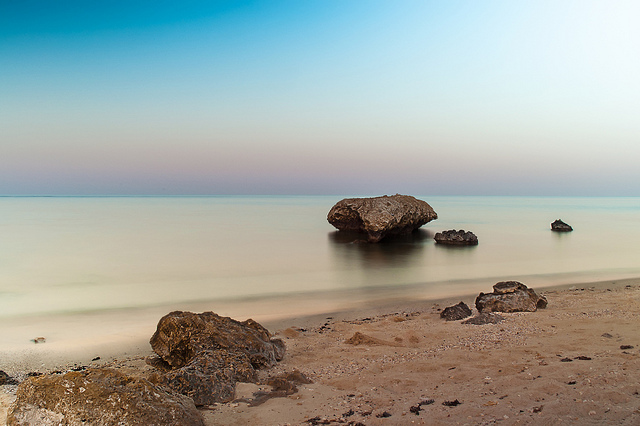
Photo Credit: anselmziegler. Via Flickr.
A line of water carved between the continents of Africa and Asia, the Red Sea has long been a hub of human activity, providing a route of commerce and source of fish for civilizations across millennia. Continue reading
On March 16th the National Oceanic and Atmospheric Administration held a webinar for scientists around the U.S. with presenters Daniel Pauly and Dirk Zeller from the Sea Around Us.
With over two dozen scientists in attendance, Pauly and Zeller discussed catch reconstructions, the Sea Around Us website tools, and their recent paper in Nature Communications.
For a PDF copy of their presentation slides: Click here