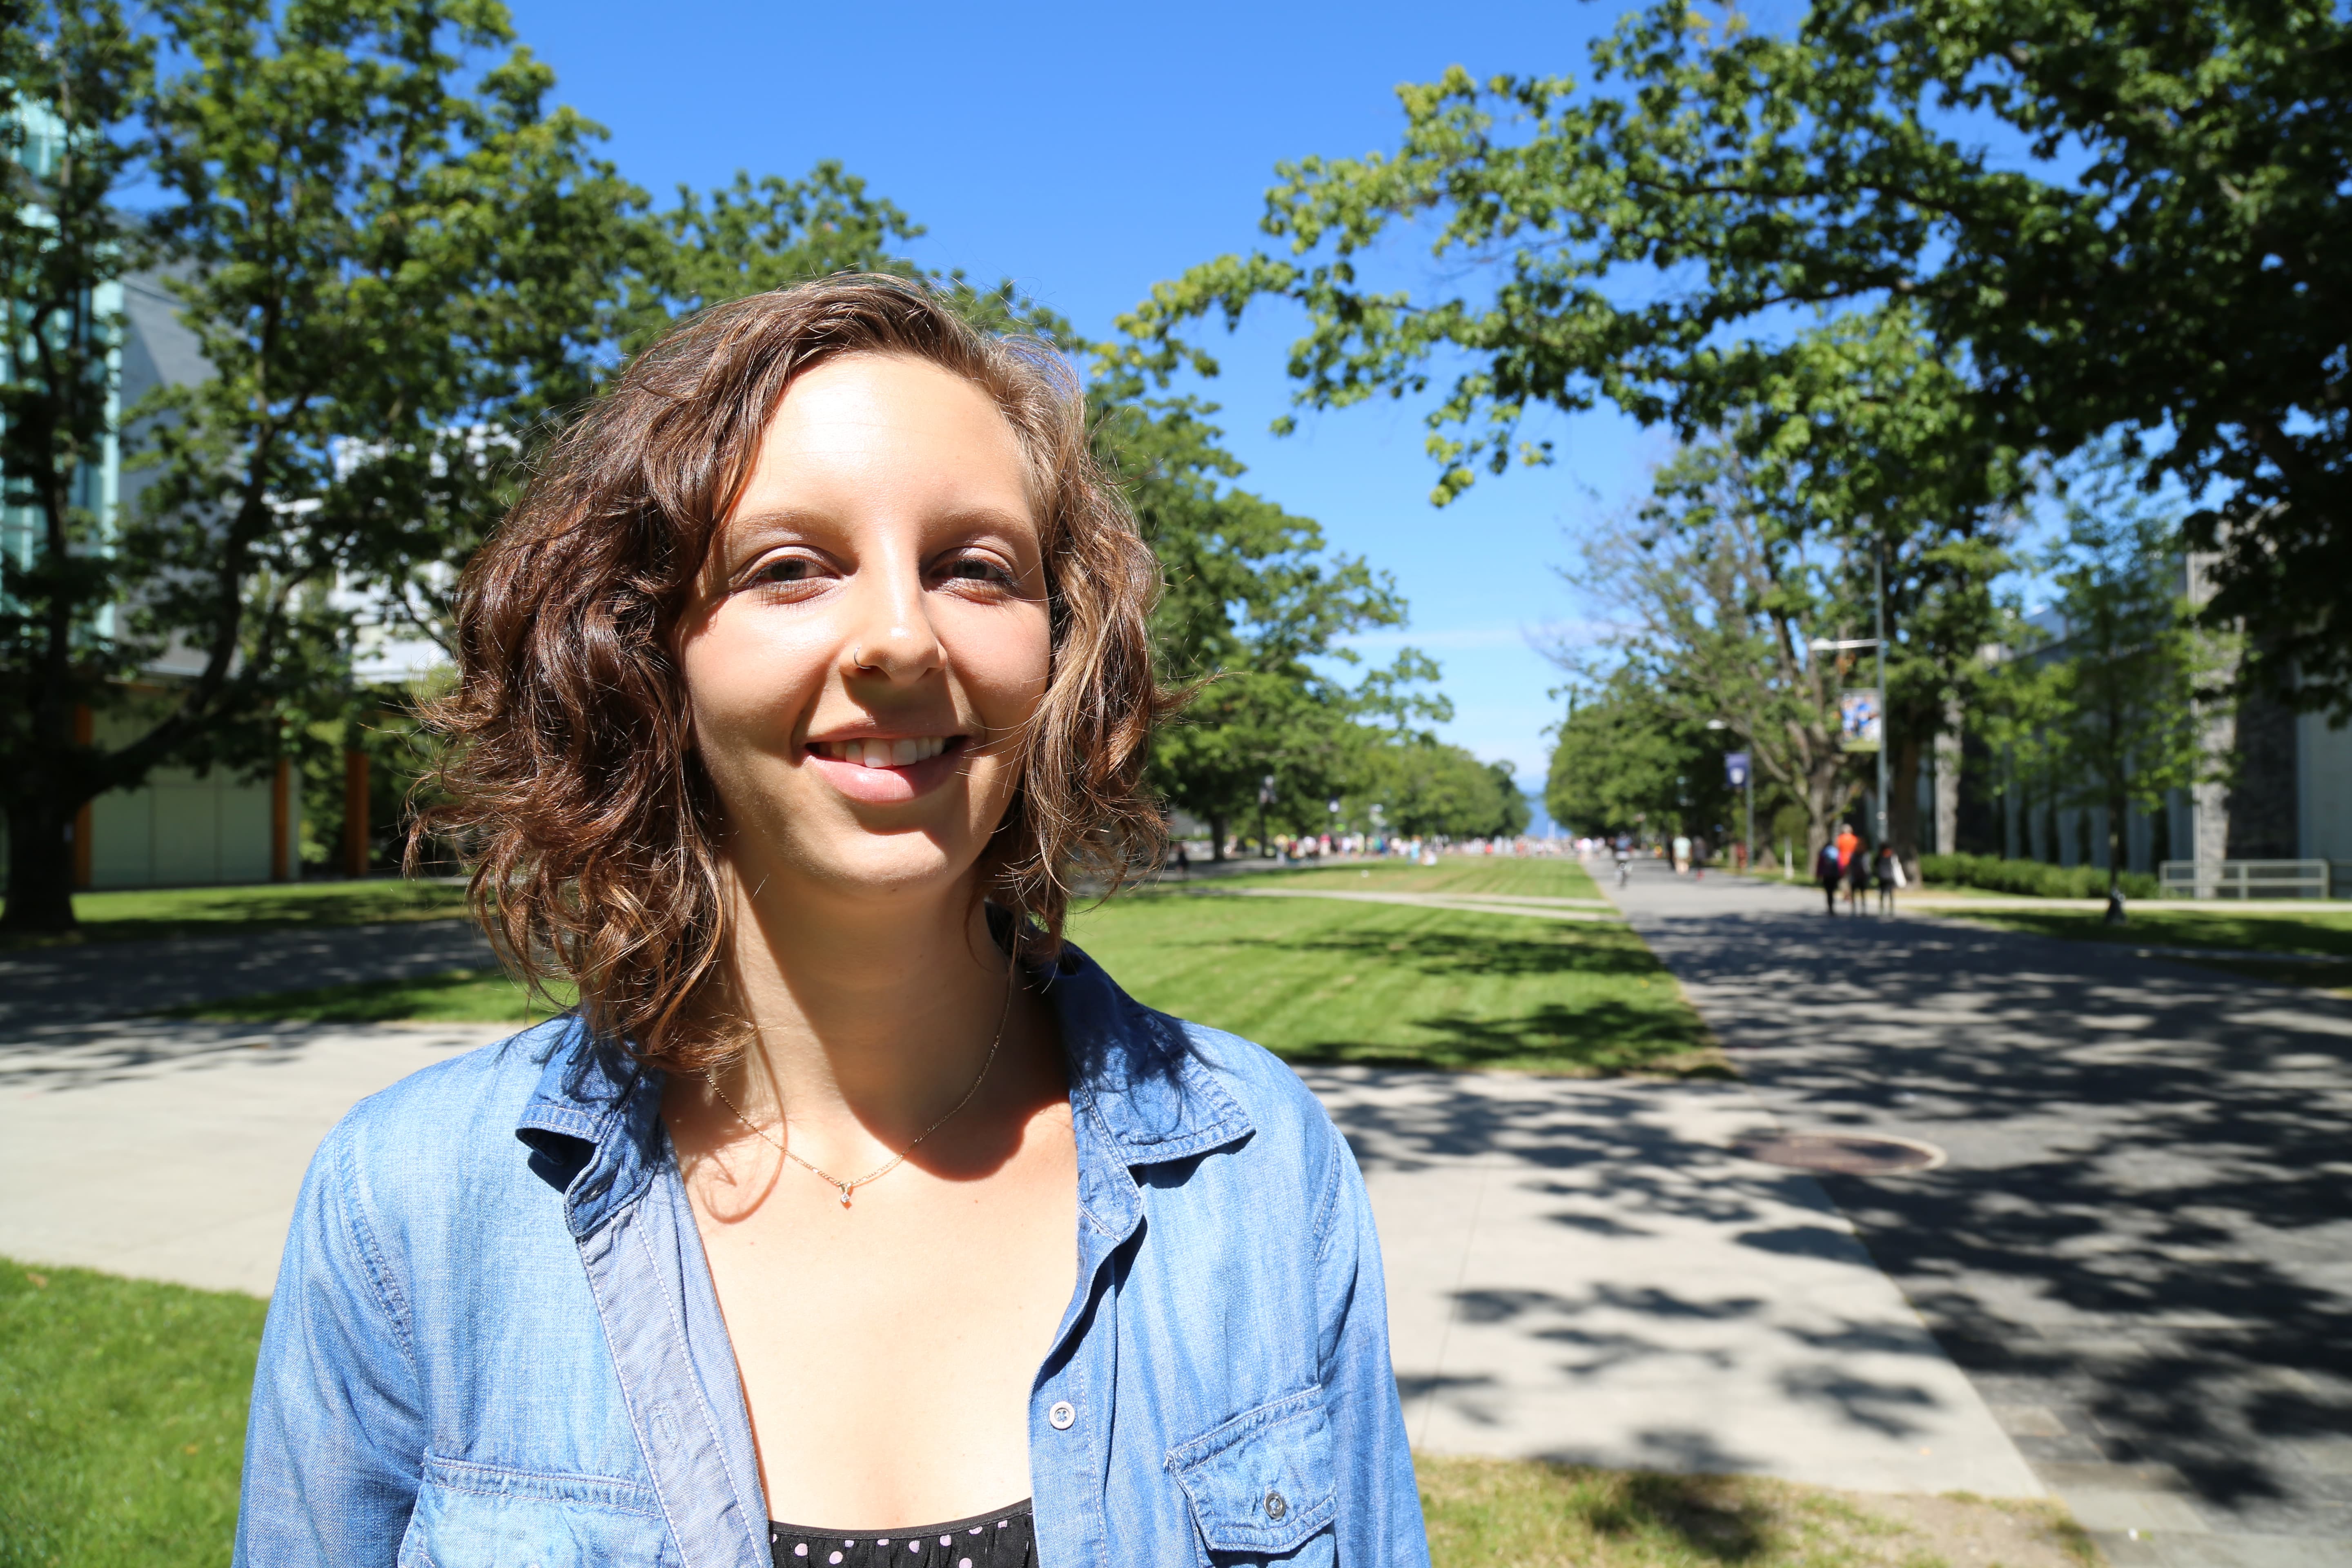
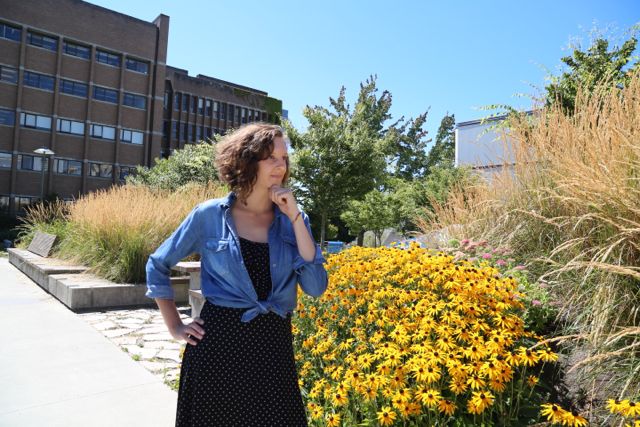
Webinar May 17: The View Past Peak Catches: Global Catch Trends in Marine Fisheries

OpenChannelsLogo

On Tuesday May 17th Daniel Pauly and Dirk Zeller from the Sea Around Us will conduct a webinar through OpenChannels.org to discuss catch reconstructions, their recent paper in Nature Communications, and upcoming projects.

Event Date: Tuesday, May 17, 2016 at 1pm US EDT / 10am US PDT / 5pm UTC

To register, click here.

How much fish are we really catching from the world’s oceans? Catch data are important in fisheries research, but the availability of reliable and comprehensive catch data is often taken for granted. In a large number of countries, reliable catch data are not available, and the catch data these countries submit to the Food and Agriculture Organization of the United Nations (FAO) are incomplete and highly variable. Given the role of FAO in world fisheries, this means that many of the “big numbers” cited when talking or writing about global fisheries are erroneous. We present a “catch reconstruction” approach that we have applied to all maritime countries of the world to overcome this situation. (Read about this effort in the Nature Communications journal article “Catch reconstructions reveal that global marine fisheries catches are higher than reported and declining”.)

In this webinar, we will present our scientific approach, results from several countries illustrating the issues and problems, and the global results as presented in our recent paper. All materials and data for all maritime countries in the world (plus a wide variety of additional data and information items) are freely available for download at www.seaaroundus.org. We always welcome communications and feedback on our work and the data we present.

Webinar co-sponsored by MEAM, OpenChannels.org, and the EBM Tools Network.

Biodiversity of Sea Around Us catch data

The Sea Around Us Biodiversity tool gives users access to key information regarding taxa in our database.

When searching for information regarding Bigeye tuna (Thunnus obesus) in Australia’s EEZ, the following information is displayed:

BiodiversityBigeyeTuna

Other filters that can be used for the Biodiversity tool include LME, RMFO, FAO area, and High Seas regions, for each country; and also filters by taxon level and taxon group.

The Biodiversity tool pulls much of its information from the FishBase database.

Users can also find global catch data for each taxa. For example, below is the interactive graph for Bigeye tuna:

BiodiversityBigeyeTunaGraph

From the Sea Around Us Methods document:

“…there are 2,039 species level taxa in the Sea Around Us catch database (number subject to change over time), which currently belong to 262 genera, 187 families, 19 orders, 11 classes and 5 phyla.”

Fisheries Economics

The landed value of commercial fish in the Gambia, 2005

The landed value of commercial fish in the waters of the Gambia, 2005

If and how well a fishery is managed often depends largely on the economics of that fishery, and central to understanding the economics of a fishery are the availability of data.

The Sea Around Us, in collaboration with the Fisheries Economics Research Unit (FERU), has over the years built extensive datasets of economic information – like ex-vessel prices and subsidies data – which are being made available to policy makers and the public.

Many of the existing price databases today are either incomplete or unavailable to the public. Using the reconstructed catch data from the Sea Around Us, and the economic datasets assembled by FERU, the information we have is well-organized and easy to access.

Further, while the United Nations Food and Agriculture Organization (FAO) publishes processed and product fish prices, they do not present ex-vessel price, i.e., the price at first point of sale a fisher realizes upon sale of their catch. The Sea Around Us does include this price, thus allowing emphasis of the economic value on the core actors of the industry – the fisher.

Therefore, the landed values data the Sea Around Us presents via our website expresses the ex-vessel value (in US$) of the catch to the fisher (i.e., catch multiplied by ex-vessel price), and excludes added value through the economic value chain.

Fishers in Ha Long Bay, Vietnam. (Credit: Rafa Prada)

Fishers in Ha Long Bay, Vietnam. (Credit: Rafa Prada)

In partnership with FERU, work is ongoing to build and incorporate other economic datasets into the global database of the Sea Around Us.

As Dr. Rashid Sumaila, the Director of FERU writes: “To be able to devise management policies that appropriately take account of fisher behavior and thereby ensure the sustainability of fisheries resources, managers need to have a good knowledge of ex-vessel prices for the species under their management” (Sumaila et al., 2007).

Using our separate fisheries economics tool (bit.ly/1Z4ybDd), researchers and other interested users can find the time series (1950 to currently 2010) of landed values for the various different taxa in the catches from EEZ’s and LME’s. And, by having landed values, Sumaila writes, researchers can better determine the “local, regional and global economic and social impacts of different management policies.”

But the Sea Around Us and FERU also provide another core economic dataset: Data on fisheries subsidies.

While some subsidies can be beneficial to fisheries; Sumaila found, in another paper, that the “amount of subsidies provided by governments of the world to their fishing sector is quite large and that most of these subsidies lead to overcapacity and overfishing.”

With our fisheries economics tool, researchers can examine the amount of money that countries spend on fisheries subsidies, broken down into categories like fisheries services, research and development, tax exemptions and fuel subsidies, among many others.

And more importantly, we also determine whether the subsidies that are used are ‘beneficial,’ ‘harmful,’ or ‘ambiguous,’ the latter meaning it is not always straight forward to determine the effects of the subsidy.

This information is all directly and easily accessible for researchers, NGO’s and governments to use.

References:

Sumaila, U. R., Marsden, A. D., Watson, R., & Pauly, D. (2007). A global ex-vessel fish price database: Construction and applications. Journal of Bioeconomics 9(1), 39–51.

Sumaila, U.R., Khan, A., Duck, A., Watson, R., Munro, G., Tyedmers, P. & Pauly, D. (2010). A bottom up re-estimation of global fisheries subsidies. Journal of Bioeconomics 12:201–225.

New website tool: Taxon Distribution Maps

TaxonDistributionsZoomed
 
Want to know where marine taxa that are part of the Sea Around Us global catch data occur around the world?

On our website we now offer taxon distribution maps that we use in our spatial allocation of global catches. Note that these distributions are based on the taxon distributions parameters as described in our methods. If you click on our mapping tool, there is now a tab that allows users to search for these taxon distributions — and see in what regions they are likely to occur. (Figure 1).

Figure 1. The taxon distribution tab is found within the mapping tool.

Figure 1. The taxon distribution tab is found within the mapping tool.

Similar to our catch allocation mapping tool, which shows where taxa are caught globally, the taxon distribution map uses the same colour scheme to illustrate the relative probabilities of a taxon’s biological distribution: Red indicates a high probability of occurrence, and, on the other end of the spectrum, blue denotes a low probability of occurrence.

Taxon distribution maps are rendered using a variety of data, with many being provided via our research partners FishBase (www.fishbase.org) and SeaLifeBase (www.sealifebase.org). Several geographic and ecological filters are applied, which includes the type of habitat species are found in — like coral reefs, estuaries, seamounts, continental shelves or slopes etc.. The methods used to derive these distributions should be consulted.

Figure 2 shows the distribution of jacks (family Carangidae), which is a cosmopolitan family.

Figure 2. Taxon distribution map of Jacks (family Carangidae)

Figure 2. Taxon distribution map of Jacks (Carangidae)

Our taxon distribution maps are presented to allow users of our catch data to examine one of the key ingredients of our global catch data allocation.