
The Sea Around Us is gaining feedback from its scientific and research users to create more robust tools and stronger web content.
On Tuesday October 26, several researchers met in Seattle, Washington to discuss improved methods for disseminating and displaying data on the Sea Around Us website.
Scientists from the Ocean Health Index, the University of Washington, and the National Oceanic and Atmospheric Administration (NOAA), among several other organizations, provided practical feedback about improvements that could enhance the utility of the web services provided by the Sea Around Us.
“Everyone was interested in the process by which the Sea Around Us reconstructs catch data, and how they can optimize the extraction of data for their research needs from the website,” said Dr. Deng Palomares, senior scientist with the Sea Around Us.
The researchers provided feedback for potential additions to the tools and data – like a user’s guide for maps; an easier system for providing feedback on data or potential corrections; and even an area for policy suggestions for non-scientific users.
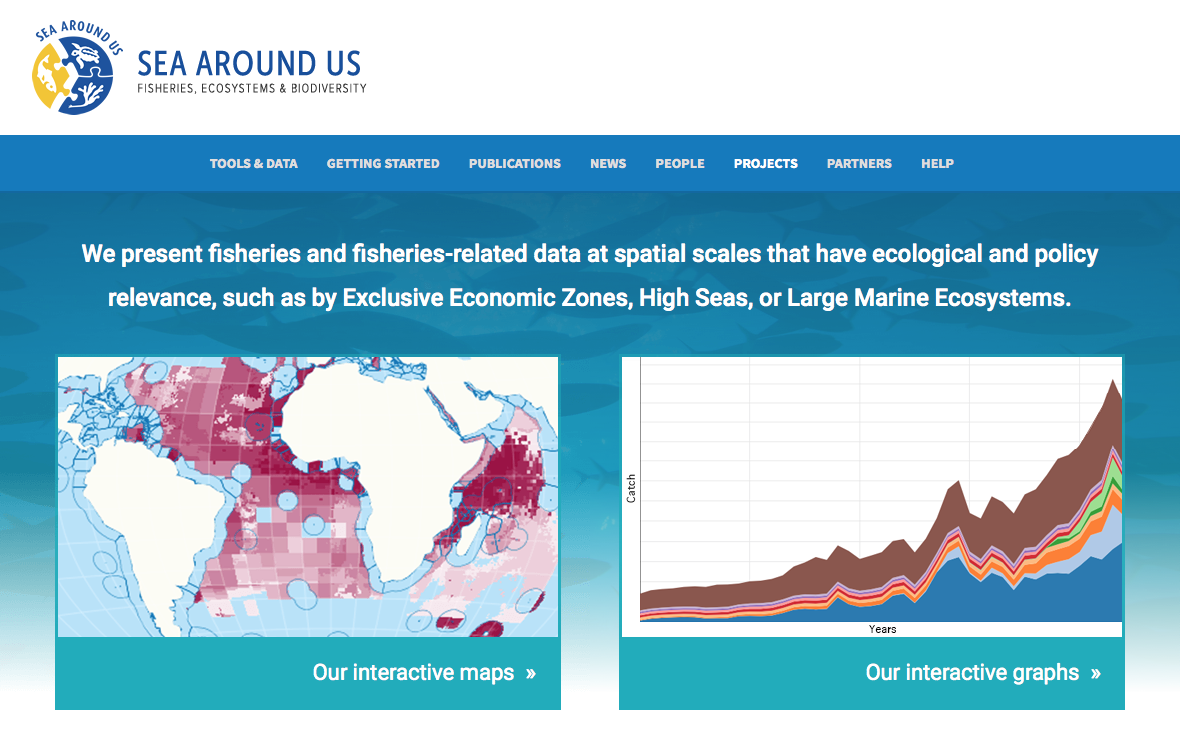
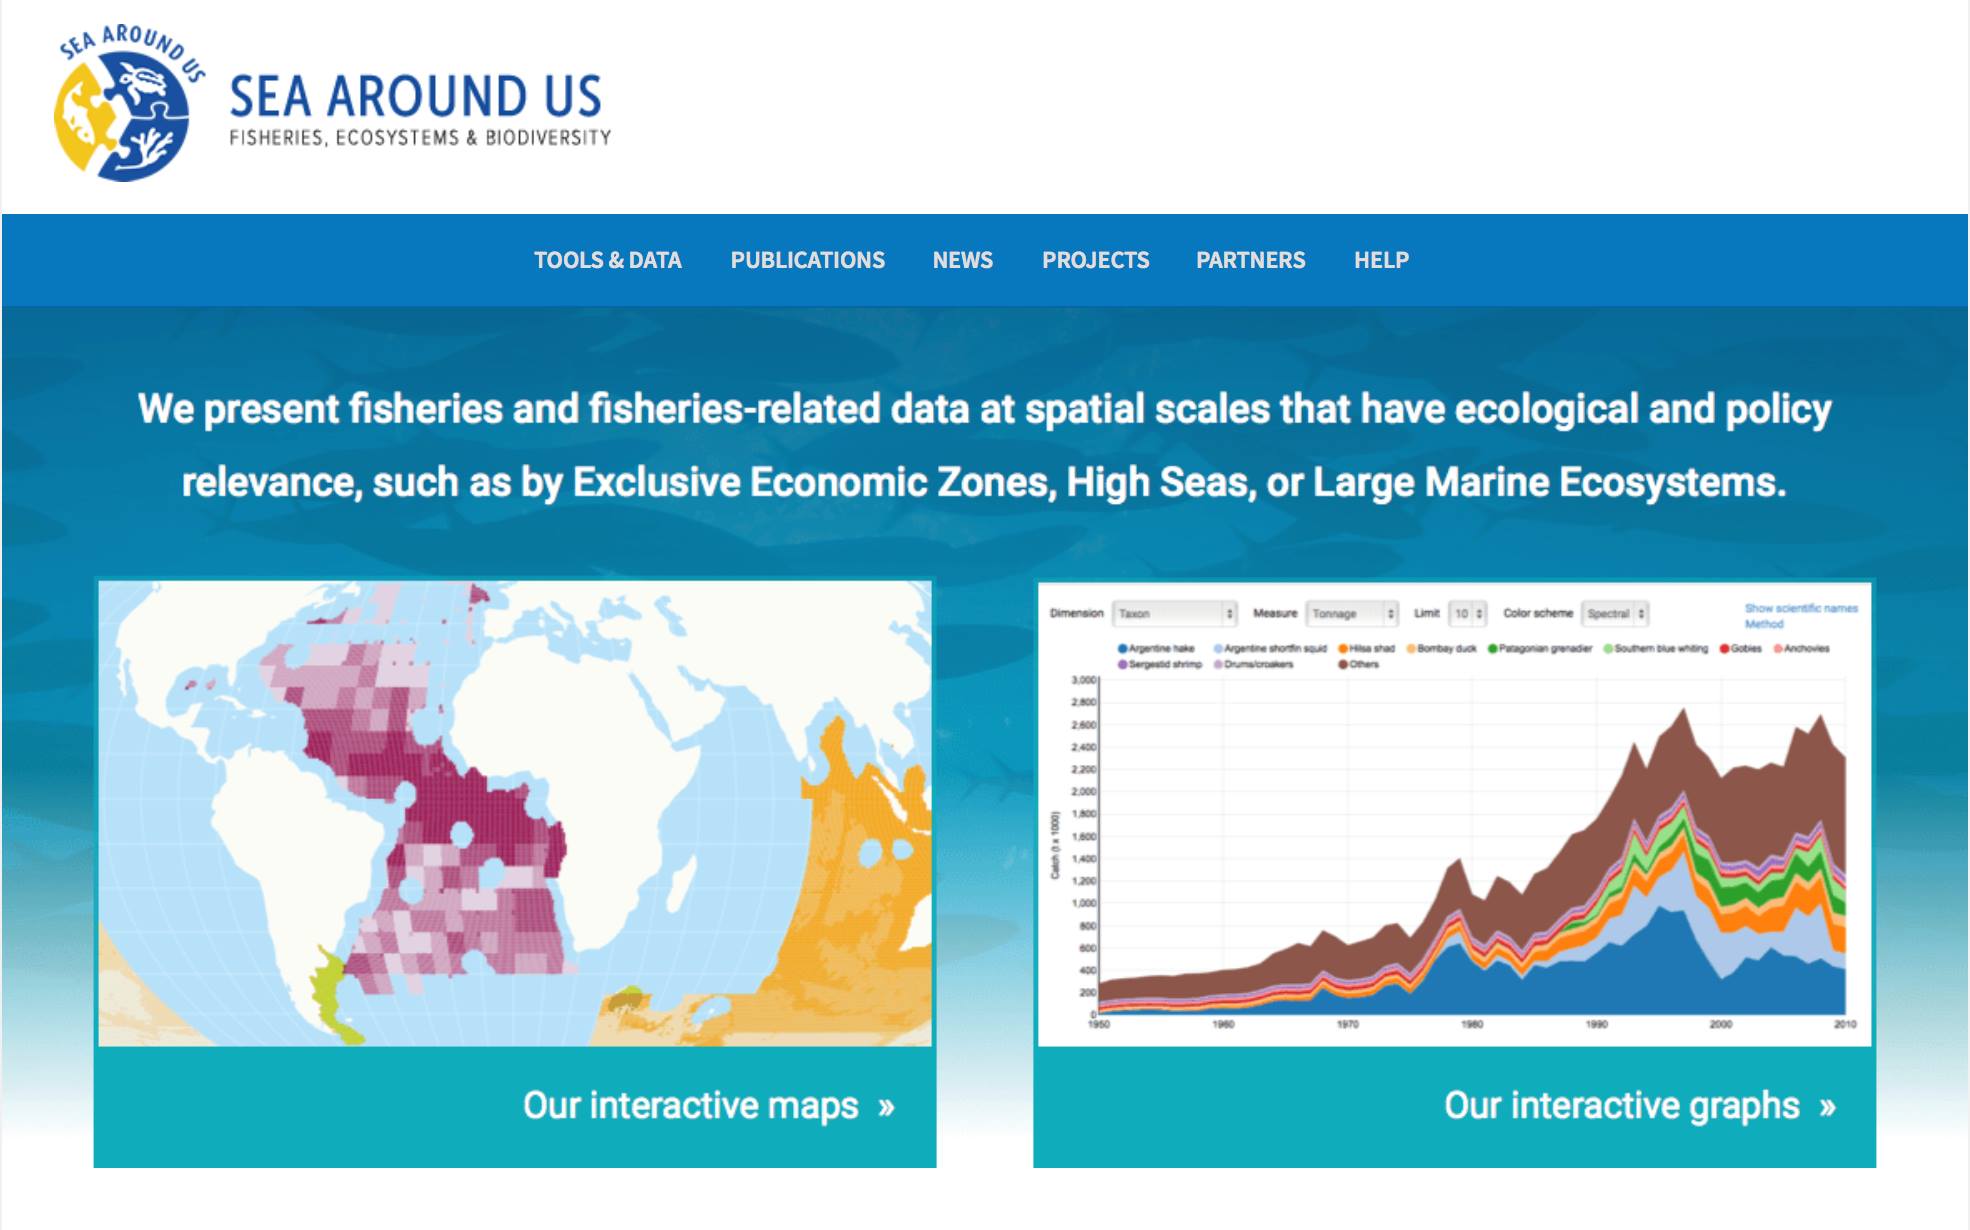
Many of the researchers were impressed with the mapping tool. The tool creates visual impressions of where fish are caught and what countries are catching them – throughout time from 1950 to 2010.
“They were very impressed by the mapping tool and its potentials and said it was the most powerful tool we have ,” said Palomares.
“It was important to receive feedback today from user groups, and how they appreciate and utilize the Sea Around Us website,” she added.