
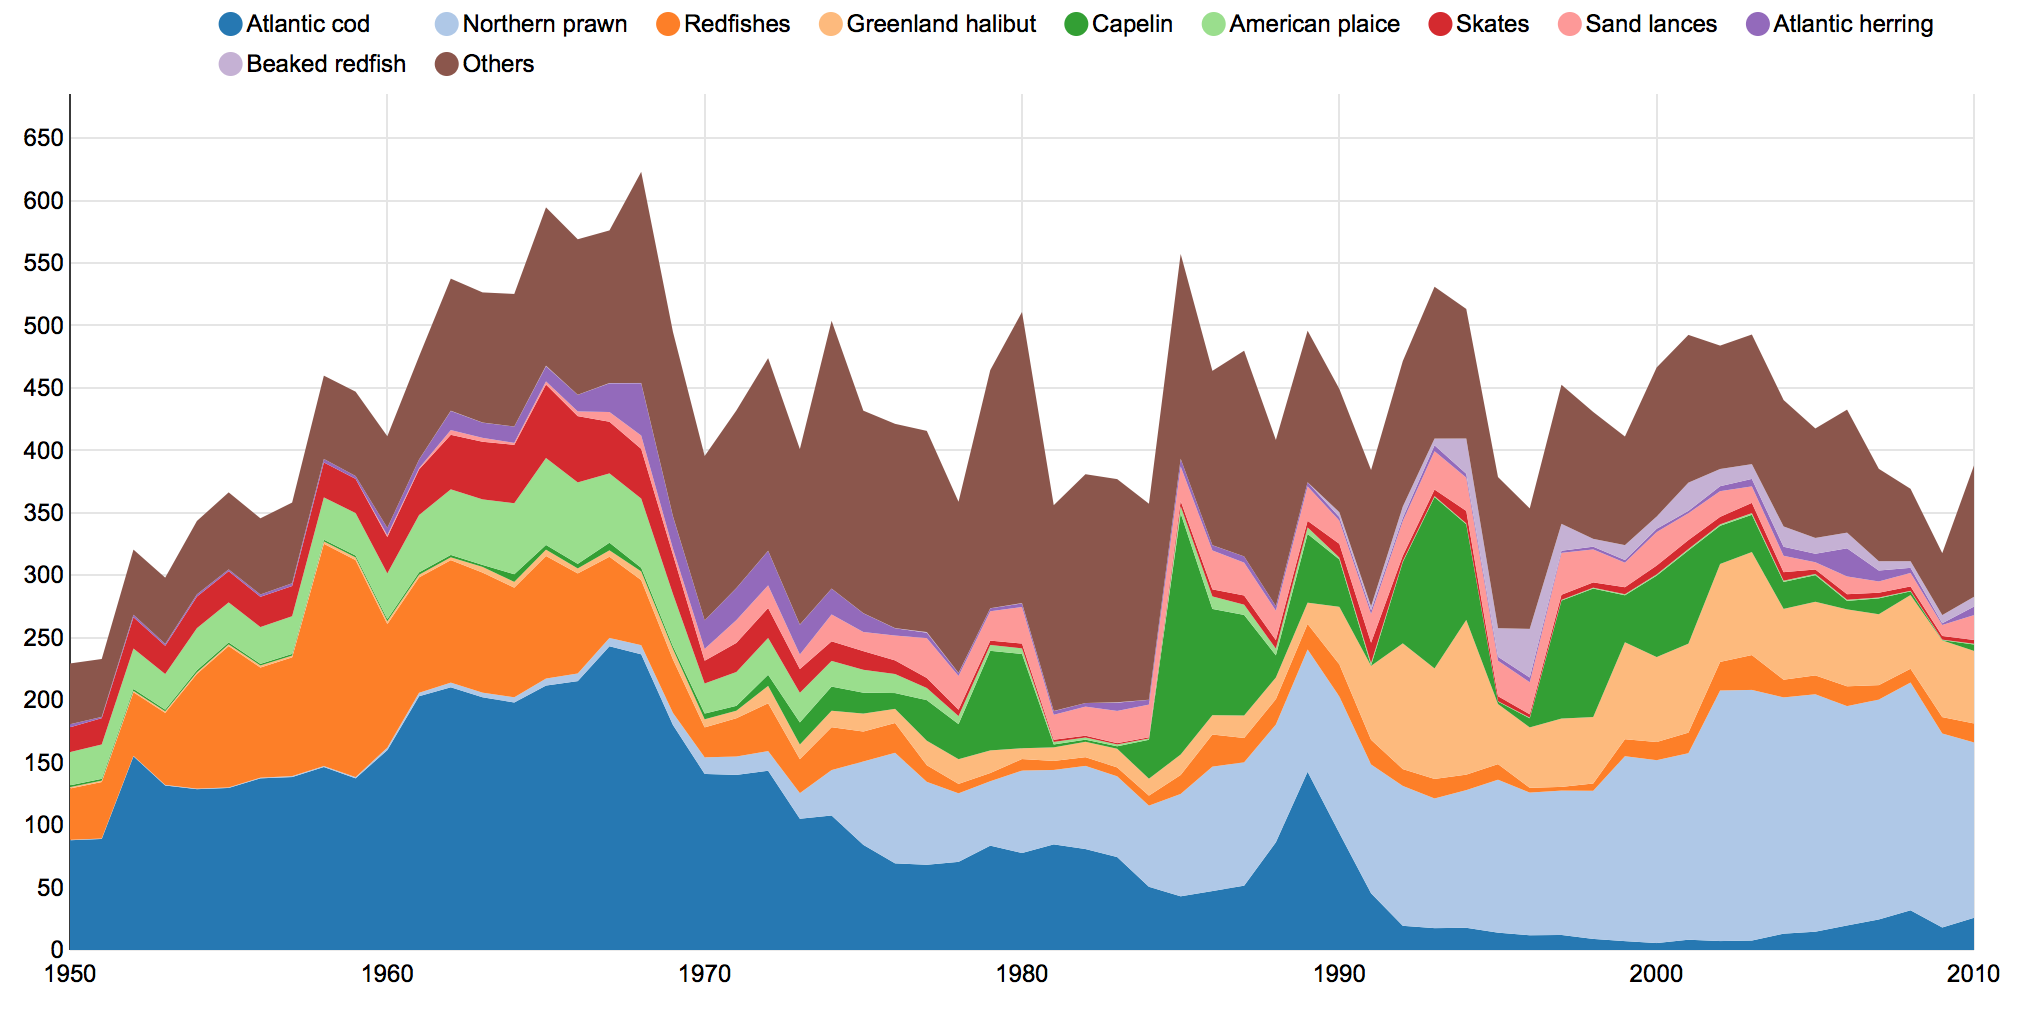
The Sea Around Us provides interactive graphs that display a wide variety of catch information.
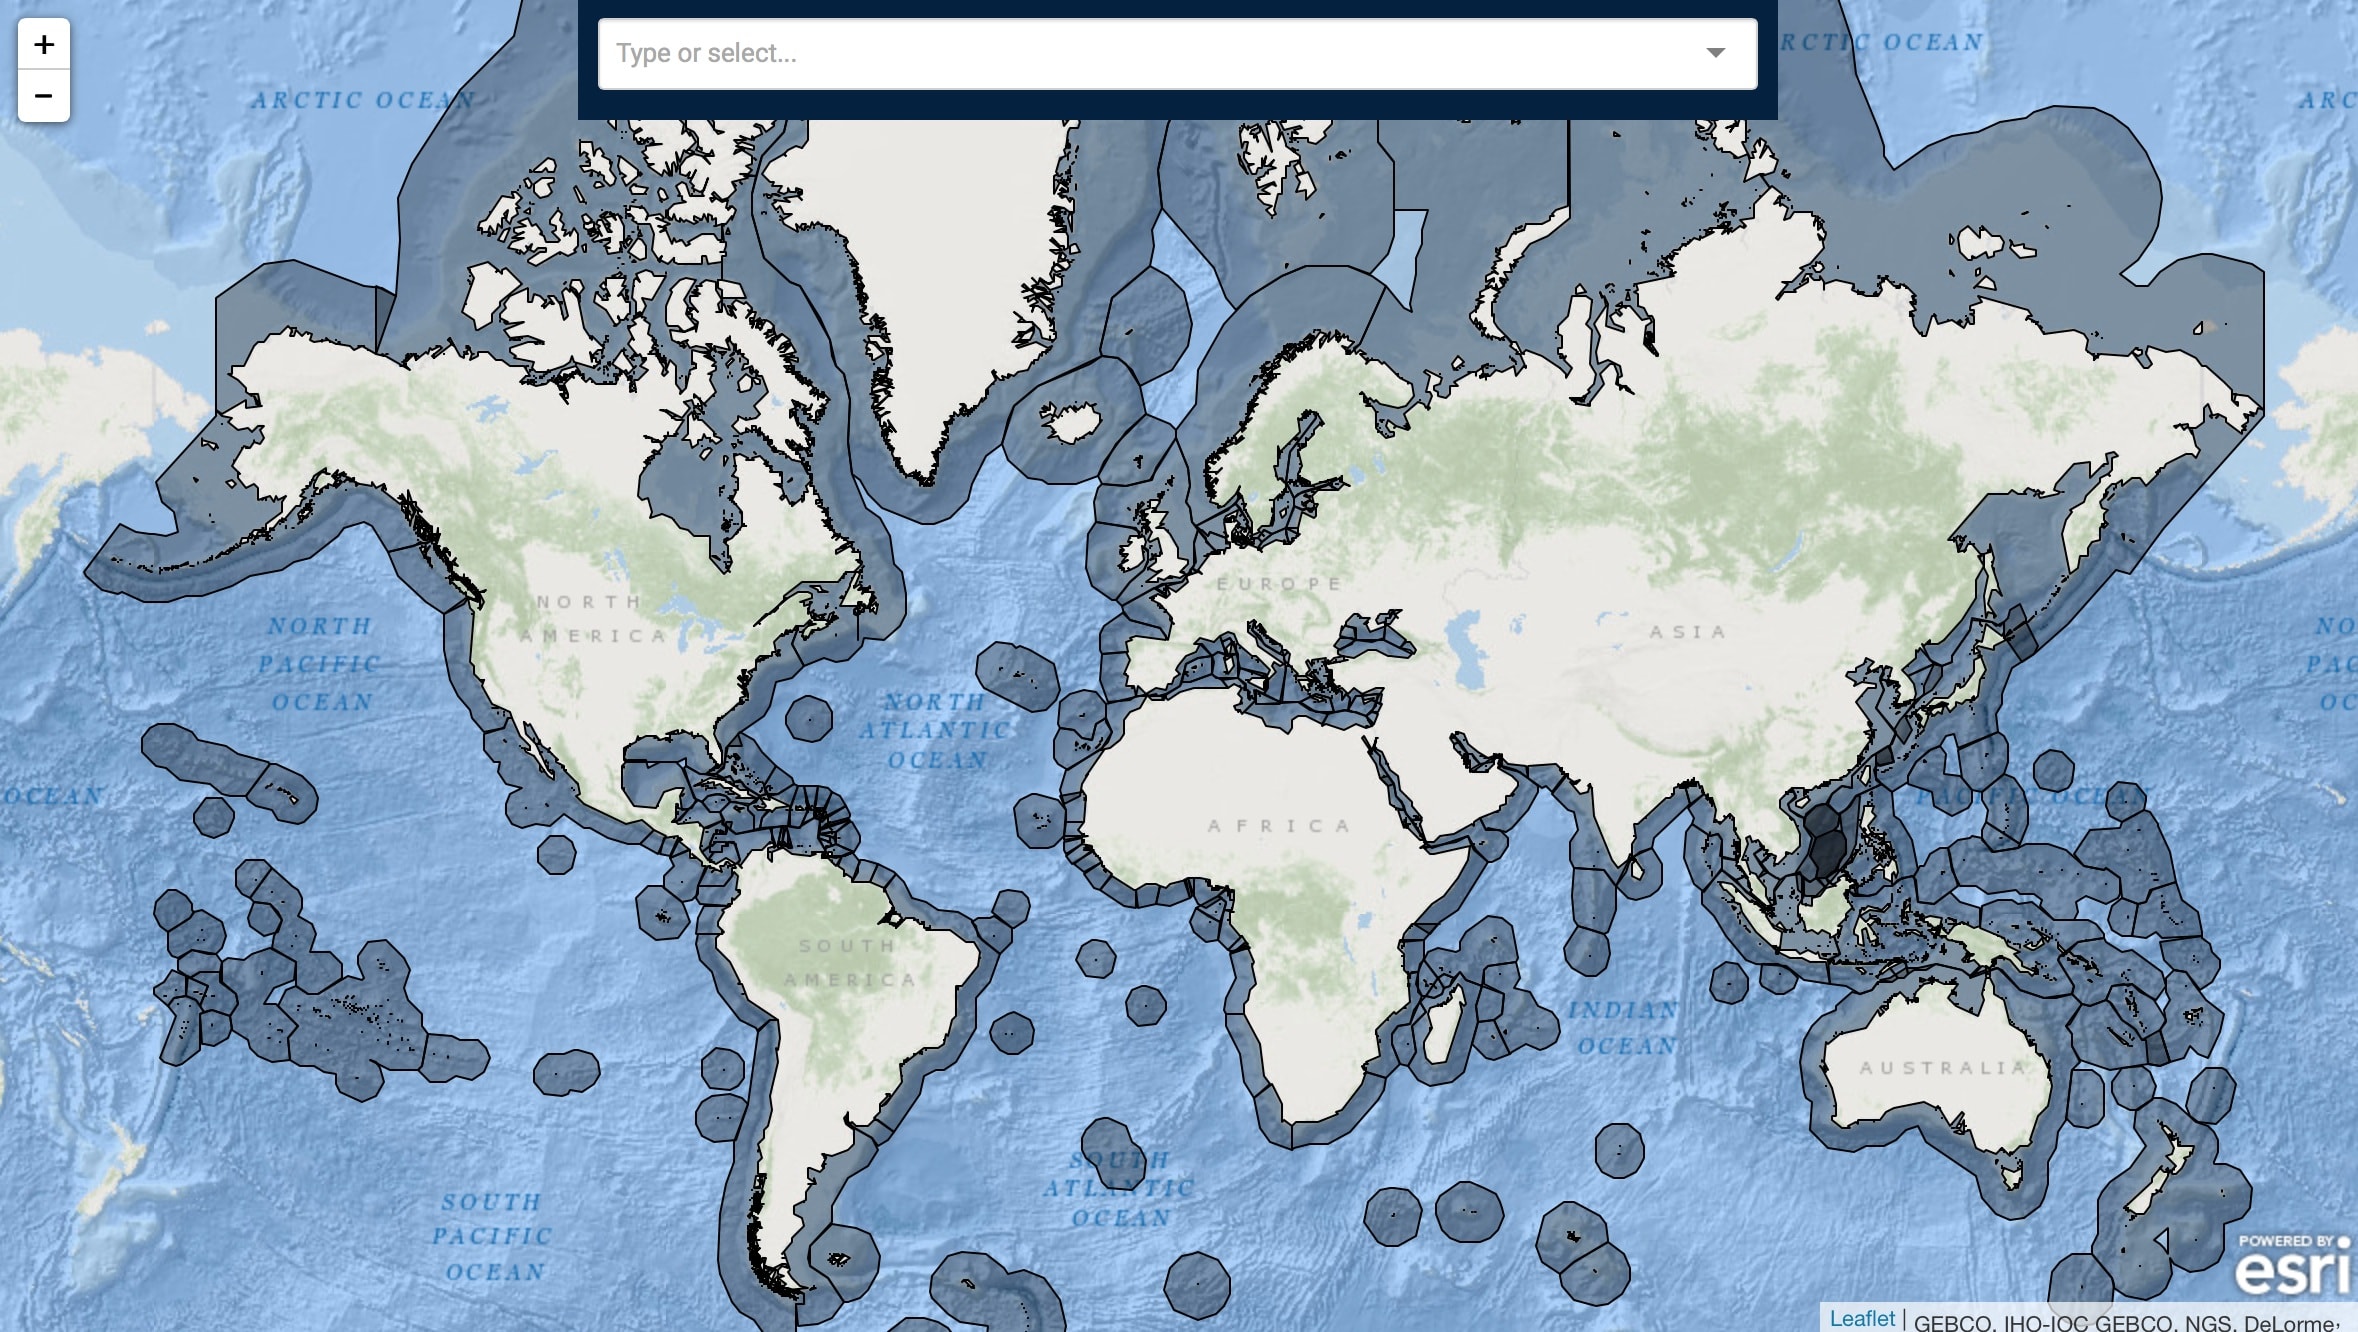
Users are able to view, analyze and download data and references across multiple regions, including Exclusive Economic Zones, Regional Fisheries Management Operations, Fishing Country, FAO areas and Large Marine Ecosystems.
Users can also view trends across time — from 1950-2010 — within each area, as they relate to taxon, commercial group, and functional group, among many others.
All allocated catch data are available for download via CSV file. For further information on how to use the graphs, click here.
And to sign up for our email News Alert for more Sea Around Us information, click here!