
The Sea Around Us interactive graphs now have a new feature.
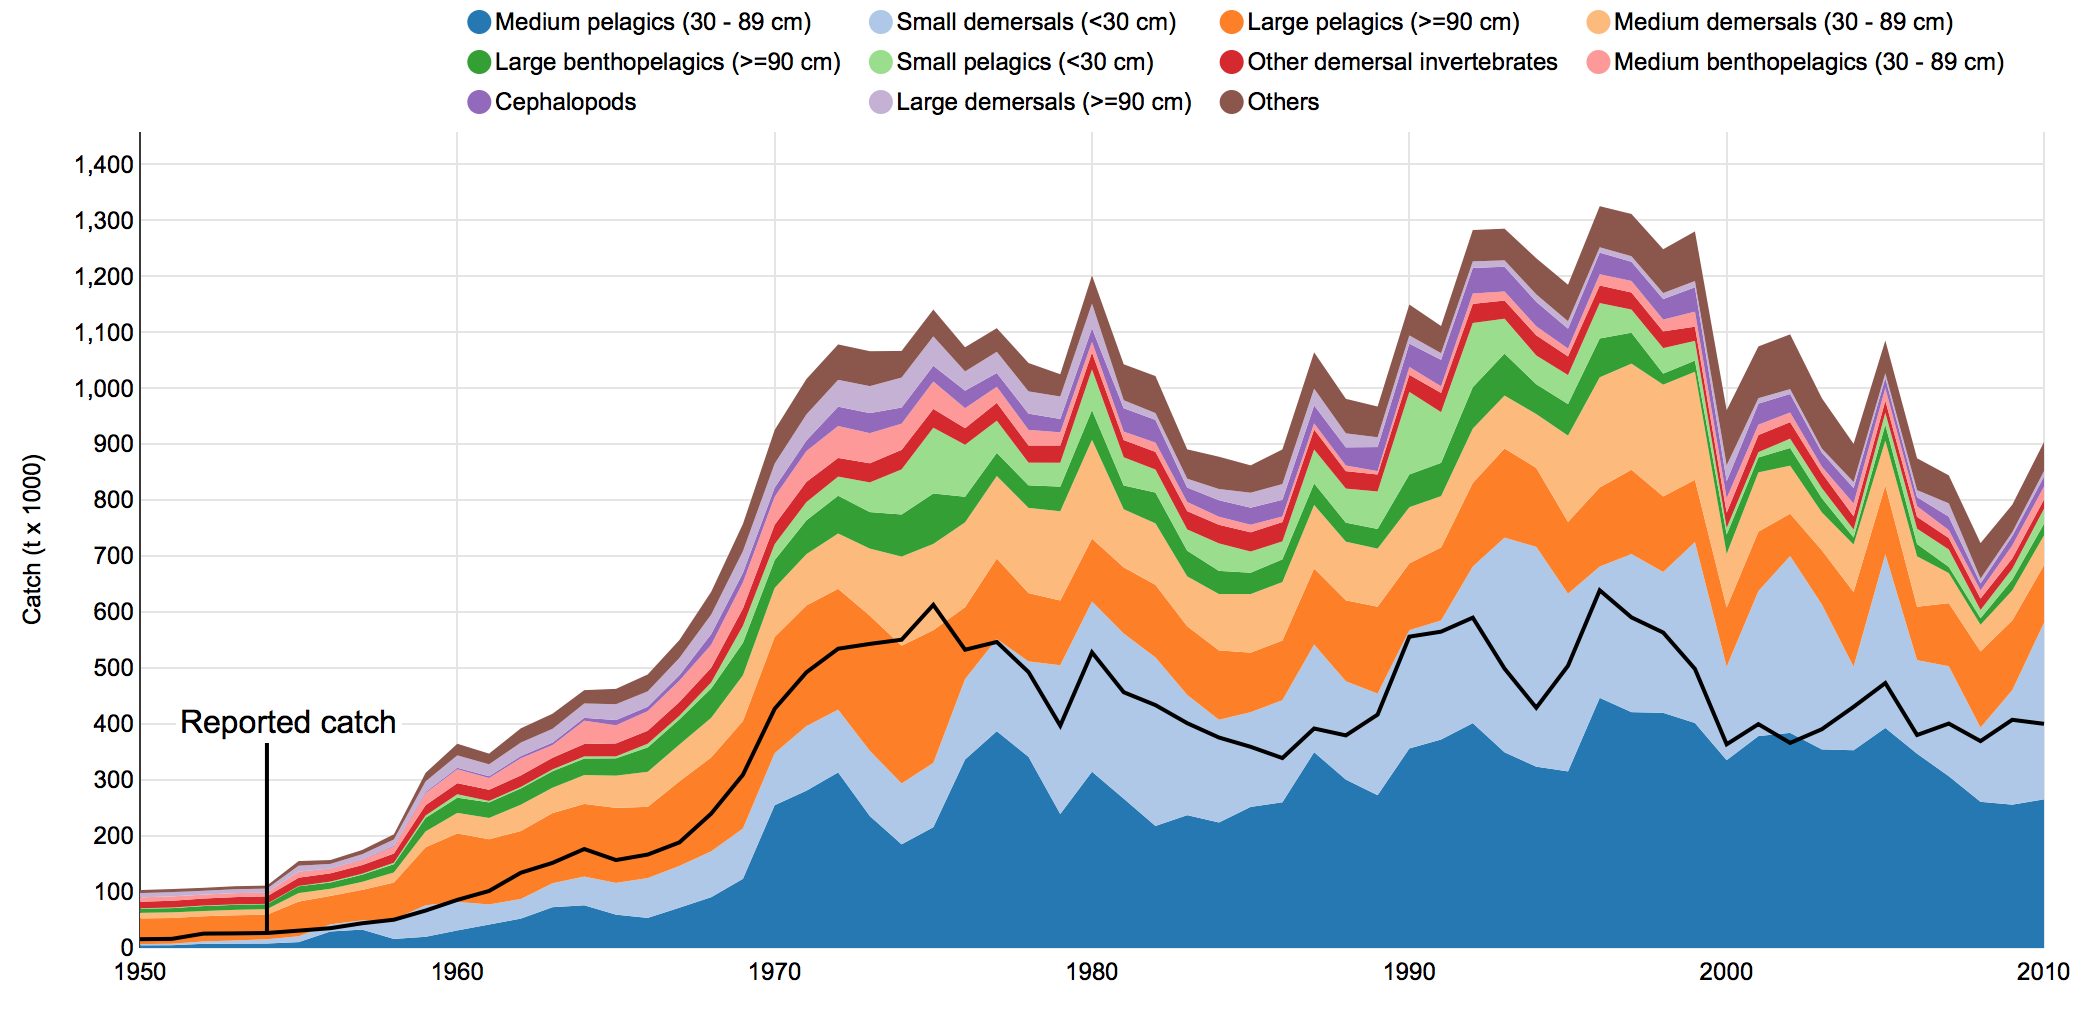
A black line that indicates reported catch is now visible in the graphs..
This can be used to better gauge the difference between reported and reconstructed catch.
A review previously done by FAO staff recommended that a line be included to indicate what the reported catch was, and for it to overlay the reconstructed catch graphs.
As can be seen in the following graph, in the waters of Senegal in 1980, where multiple countries fish, the reported catch was around 550,000 metric tonnes, while the reconstructed catch was 1,200,000 metric tonnes. A difference of close to 650,000 metric tonnes.
For more information on the Senegal EEZ, click here to view the reconstructed catch data.